Sep
2020
Underground Bangers: looking for hidden gems in smaller investment trusts
DIY Investor
5 September 2020
This is not substantive investment research or a research recommendation, as it does not constitute substantive research or analysis. This material should be considered as general market commentary.
 In recent years smaller investment trusts have been under pressure. The demand for smaller vehicles has been reduced by two factors: the consolidation in the wealth management industry and the increasing prevalence of centralized buy lists used by DFMs and advisers.
If a large amount of money is being managed to a model, then allocations can be impossible to deal into a small trust. Anecdotally, the lower limit of viable size for professionals has been rising.
£200m is a more realistic cut off point than £100m, and even that is not enough for some. The lower charges and greater liquidity of larger vehicles also makes them more attractive in the current environment.
The COVID-19 pandemic has unleashed forces which seem to be increasing this pressure. Lower demand for assets has been caused by concerns about market direction and worsening personal circumstances, reducing the ability or willingness to invest.
This trend is visible in flat investment trust industry assets over the first half of 2020.
In addition we see this trajectory in the widening of the average discount in the universe from c. 1.9% at the end of January to c. 8.6% by the end of June – even if certain assets seen as invulnerable to the crisis have bucked this trend.
Wide discounts can bring the long-term viability of a vehicle into play. Whereas the lack of investment demand creates greater competition for capital, which could further starve the smallest trusts of attention.
However there are many investors who do not have the same liquidity restrictions as large, consolidated wealth management businesses operating model portfolios or buy lists.
These include wealth managers with greater discretion over which funds they can use for individual clients, and individual retail investors managing their own money.
For them the 50% of investment trusts which have less than £200m in market cap offer a variety of opportunities, which their peers can’t or won’t access. While some smaller trusts follow similar strategies to larger trusts, others are clearly differentiated and offer a way to diversify asset exposure of sources of alpha.
Moreover the pressures of the COVID-19 pandemic could lead to an alternative source of return: wind ups or mergers which close persistent discounts.
There has been a spate of recent corporate actions which show that some boards are willing to take extreme action, including the merger of Perpetual Income & Growth and Murray Income.
While these two trusts both have over £500m in net assets, we think the boards of some smaller trusts could be considering this approach. The board of the £24m JPMorgan Brazil has recommended that shareholders vote against continuation at its 17 September annual general meeting.
It will be interesting to see whether they propose a rollover into the two remaining Latin American trusts. BlackRock Latin American would seem the most likely option, in that case, as Aberdeen Latin American Income is also very small (£34m net assets).
We think it more likely that those small trusts, which are not clearly differentiated, could suffer such a fate if they can’t stand out and grow, either through share issuance or organically thanks to outstanding performance.
Below we consider some advantages and disadvantages of smaller trusts, before considering some funds which stand out to us as offering differentiate strategies with the potential to grow.
Discount
Smaller trusts offer investors a greater opportunity to buy on a discount. In the table below we have sorted all AIC investment companies by net assets (the invested capital) and split them into £100m bins, from 0 to £1bn (above that the number of trusts become too low for averages to be meaningful).
We have then calculated the average discount for each bin. There is a clear relationship between size and discount, as shown by the trend line.
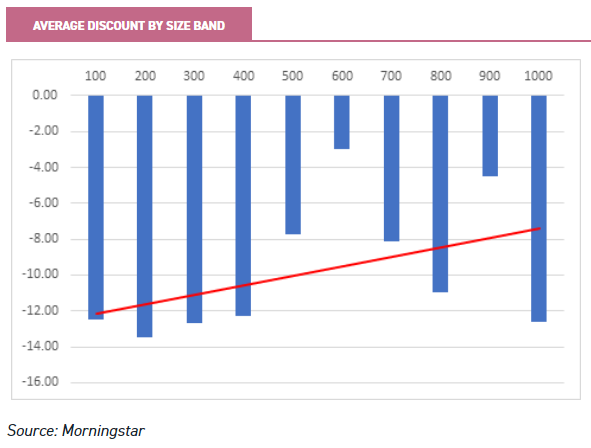
The pattern is broken somewhat by the high score for the largest bracket, but this is due entirely to one trust: BMO Commercial Property Trust, which sits on a 50% discount to NAV.
This obviously reflects the extreme uncertainty in the commercial property market in the aftermath of the lockdown policies. If we exclude the property sectors from the data the relationship is even stronger, as the below graph shows.
However the largest effect, by a considerable margin, is in the largest bracket – thanks to the effect of BCPT on a small population of eight trusts.
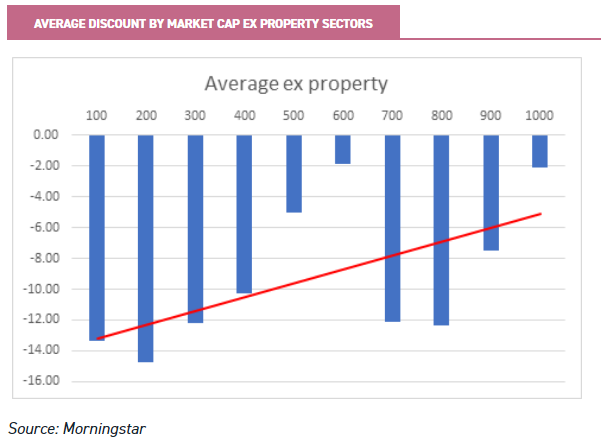
It is worth noting that the number of trusts in the higher bands is lower than in the lower bands, so more variability would be expected.
Furthermore these are averages, and it is far from the case that all small trusts trade on wider discounts than their larger peers. In fact demand can be very strong for some small trusts which have carved out a niche.
Indeed some small trusts manage to grow into large ones, thanks to being able to issue shares while trading on a premium. We consider some such examples below.
Nevertheless there are a number of reasons a smaller trust might trade on a wider discount, all other things being equal. The inability or unwillingness of a certain group of buyers to get involved could contribute.
A smaller marketing budget could lead to lower awareness by investors who might be interested, even if performance is good and the strategy differentiated. Higher charges could also deter some investors.
Liquidity
All these factors keep investors away and contribute to lower liquidity, and lower liquidity is a rational reason for smaller trusts to trade on a wider discount.
If selling is more costly, it stands to reason that an investor would demand a greater discount to the value of the assets when buying. Low stock liquidity and trading volumes can become self-fulfilling for some smaller trusts, with larger buyers less willing to take stakes they cannot be sure of unloading at a good price.
This is particularly true of large, professional investors who may potentially have to match outflows from their own portfolios. This outcome can also lead to wide bid-offer spreads, which may further deter investors.
One way of looking at liquidity is to look at the average amount of shares traded each day, either in absolute terms or as a percentage of market cap.
One problem with this approach is that the data is not good: particularly for smaller companies, it may not capture all trades. Furthermore it is only really a proxy for what most investors are interested in, which is the cost of buying and selling.
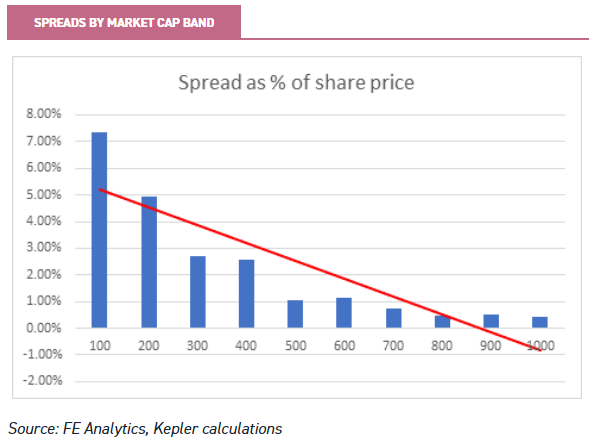
Liquidity is therefore perhaps best measured by spreads, as we have done in the graph below. We have, again, split the investment trust universe into £100m brackets up to a maximum of £1bn.
We have then looked at the average spread between bid and offer prices as a percentage of the mid-price. The reduction in the cost of buying and selling is dramatic until the £400-£500m bracket. It still continues to generally decline, but at a slower rate.
We often discuss the many advantages of closed-ended funds, so it is only fair to acknowledge that one of the few disadvantages they have relates to smaller funds.
As we discuss below, a smaller trust has less liquidity in the shares, whereas an open-ended fund’s liquidity depends upon the liquidity of the underlying investments in the market alone, so small open-ended funds can be just as liquid as larger ones.
On the other hand, it is worth noting that the high average spread in the sub-£200m bracket masks wide dispersion. There are thirteen sub £100m trusts with a spread of 2% or less, and eighteen in the £100m to £200m bracket.
This means there are plenty of investment trusts with more modest spreads at a lower size, but there is a greater risk that the spread could widen in adverse circumstances. To us this highlights the importance of being selective, and doing detailed work on the liquidity and shareholder register of a small trust before buying.
Performance
It is worth considering whether smaller trusts have an inherent performance advantage to compensate for the extra discount and liquidity risk. We can’t see any such advantage. In fact the larger trusts from five years ago have outperformed since then on an NAV total return basis.
We looked at the AIC universe as it was five years ago and stratified the trusts by size. We found that the average return was c. 6.12% annualised for the entire universe.
As the below chart shows, returns on average were much weaker for those under £100m at the beginning of the period. There is minimal difference for the other age bands, except for the very largest funds. Although we caution that there are much smaller numbers in these bands, so more variability in mean return would be expected and we would discount them from the analysis.
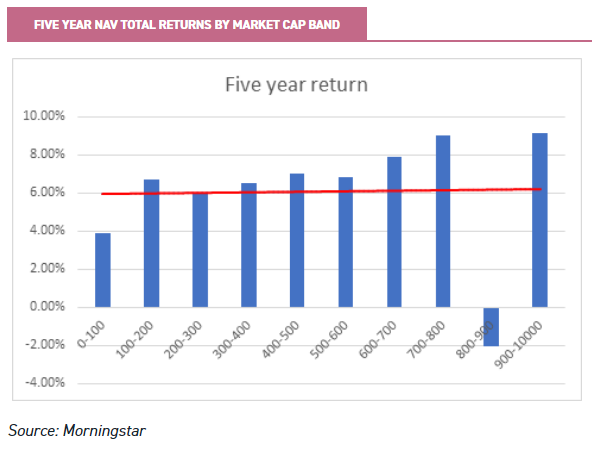
In our opinion the poor returns for the sub-£100m trusts reflects a couple of factors. First, successful trusts will tend to grow over time – either through performance or through further equity raises.
The band will contain some of these future successes. It will also contain those trusts which have shrunk thanks to being unsuccessful, never managing to achieve raises that were hoped for, and being worn down by negative performance or potentially by tender offers.
These may well cling on to life for some time, even if they are perennial poor performers. Secondly, there are a number of idiosyncratic trusts with specialist mandates set up to target a small pool of investors or with large family holding in this bracket, some of which have performed poorly.
One further interesting piece of research would be to see whether these results vary by asset class, which we have not controlled for here. It could be possible that small size is advantageous in certain sectors but not in others.
Conclusions
We have shown that smaller trusts tend to trade on wider discounts, which is at least partly explained by their larger spreads. We have also shown that plenty of individual trusts can buck these trends, and suggested that by doing so they grow and attract a wider circle of buyers.
Finally we have suggested that trusts which are doing poorly tend to fall in size or struggle to grow. This trend tends to mean that average performance, discount and liquidity for small trusts is biased downwards.
What this really means for us is that this is a very exciting place to be looking for investments. Hidden in the crowd are the large trusts of tomorrow.
The fact that certain types of investor simply can’t invest at this size means that there is a greater chance of getting in early and potentially enjoying the best returns; perhaps super-charged by a wide discount due to the lower liquidity in this part of the market.
Discounts on strongly performing trusts, which seem intractable, may suddenly become more pliable when the trust hits a certain level of assets.
As with active management in general, detailed research is going to be key to getting this right. In our view investors should be looking for differentiated strategies, which are able to excite investors as long-term plays.
Alternatively investors could look for trusts which may do similar things to their larger peers, but which have fallen out of favour. If analysis suggests the manager’s style is out of favour, or a few mistakes have been made which are unlikely to be repeated, then this situation could be a potential turnaround story.
If not then there is a growing chance that a wind-up or merger could occur, which offers the consolation prize of an exit close to NAV or a narrowing discount after a successful merger. Below we consider some trusts below £200m we think are worth consideration.
Sub-£100m
AIE
Ashoka India Equity (AIE) is, by some way, the best-performing India trust since it was launched in July 2018, as we discuss in our recent note. It has net assets of only £73m but, prior to the coronavirus crash, had been trading on a premium, allowing it to regularly issue shares.
Currently it sits on a small discount of c. 2.8%, as India struggles with the pandemic. But this figure is much tighter than its peers focusing on the country, which suggests existing investors are holding for the long term.
The spread is modest given the size at c. 2.9%, and we would expect the board to continue to grow the trust once the premium returns.
The other all-cap India specialists have net assets of c. £500m to £600m. One other feature of the trust is the performance fee only structure. This characteristic limits some of the drag on the performance of small funds, as well as the hit shareholders bear from fixed costs making up a greater percentage of net assets.
We would also note that in a specialist sector such as India – where overall allocations in a clients’ portfolio could be smaller – the size threshold a fund needs to reach could be lower for institutional investors, as the number shares likely to be required would be lower.
HOT
Henderson Opportunities Trust (HOT) invests in UK equities with a contrarian approach. It is managed by James Henderson and Laura Foll and has an excellent long-term track record, but has struggled over a five year horizon.
The trust has £78m in net assets and a market cap of just £64m. Structural gearing is high and means the trust has suffered in market crashes, such as the one earlier in 2020.
The small and mid-cap focus, contrarian approach and high level of gearing all mean that it is very much a risk-on trust. In the 2013 to 2014 mid-cap rally HOT did exceptionally well, leading to it trading on a premium at one point.
But with the UK market out of favour, and the economic outlook poor, it is currently trading on a 14% discount. Timing is likely to be key with an investment in HOT. We think it is highly geared to a UK recovery, which will come eventually – even if the current situation seems dire.
There is a wide spread of c. 7.3% (AIC) which might make it even more important to invest in it with a long-term view.
However the level of discount, to an already out-of-favour asset class, suggests there could be long-term value in the trust. In addition it is notable that trust-of-investment trusts Miton Global Opportunities (MIGO) retains a reasonable position in HOT.
BEE
Baring Emerging Europe (BEE) is the only AIC closed-ended fund focused on the emerging Europe region. This region tends to be cyclical. As a result it has been a difficult year for the trust, with NAV down c. 17%.
However, as we discussed in a recent note, the region has actually fared reasonably well in terms of controlling the medical and economic impact of the virus. BEE has shrunk to £92m in net assets but it has a modest spread of c. 1.52%, suggesting there is reasonable liquidity.
The board and manager are discussing the nature of the mandate, with a view to potentially broadening it. It remains the only trust, however, that is focused on a region which trades on extremely low valuations, and would be highly geared to a recovering global economy.
BEE trades on an 11% discount and offers a 5.3% historic dividend yield. The payout is supported by the ability to distribute up to 1% of NAV each quarter.
£100m-£200m
AJOT
AVI Japan Opportunity Trust (AJOT) has a highly differentiated approach and clearly defined investment strategy, which has seen it trade on a premium for much of the time since launch in late 2018.
This has allowed it to regularly issue shares into the market, and it has grown to £117m in net assets. Despite the impact of the pandemic, it is back on a 1.4% premium and issued shares on multiple occasions in June.
In March the company published the prospectus for an initial placing of 30 million shares and up to 55 million more in a placing programme. Those plans have been delayed due to the impact of the pandemic in the market.
We believe that the direction of travel is clear, however, and that AJOT is a good candidate to grow significantly and bring the added benefits of extra liquidity to shareholders as it grows.
The spread is currently c. 3.9%, according to the AIC. While this figure is somewhat higher than some of the other trusts we have highlighted here, thinner trading volumes seem to be a result of a lack of willing sellers relative to buyers – as indicated by the relatively persistent premium.
The strategy focuses on finding cheap Japanese companies, mainly small-caps, with large amounts of cash or securities on the balance sheet, and, in addition, taking a constructive approach to shareholder engagement to encourage the unlicking of this unrecognized value. We discuss this in full detail in our note on the trust.
CCJI
The £177m net assets of CC Japan Income & Growth (CCJI) is close to the £200m threshold which could open up a broader shareholder base.
It is the only trust in the AIC Japan sector with an income remit, and trades on a historic dividend yield of 3.8%.
Historically it has tended to trade on a premium, but has slipped onto a discount in the aftermath of the pandemic. The crisis has resulted in a poor period of relative performance, as we discussed in our recent note.
Structural gearing of 20% in a relatively indiscriminate market sell-off meant that NAV returns suffered on a relative basis in the aftermath of the pandemic; with high levels of stock correlation mitigating the defensive characteristics the stock picking process usually emphasises.
As with AJOT, the board has been aggressive in looking to grow the trust when it has traded on a premium. Despite the larger size the spread is reasonably wide at c. 4.9%. The shareholder base is reasonably concentrated, with 42% held by shareholders with over 3% of the shares (as of our latest note).

Past performance is not a reliable indicator of future results. The value of investments can fall as well as rise and you may get back less than you invested when you decide to sell your investments. It is strongly recommended that Independent financial advice should be taken before entering into any financial transaction.
The information provided on this website is not intended for distribution to, or use by, any person or entity in any jurisdiction or country where such distribution or use would be contrary to law or regulation or which would subject Kepler Partners LLP to any registration requirement within such jurisdiction or country. In particular, this website is exclusively for non-US Persons. Persons who access this information are required to inform themselves and to comply with any such restrictions.
The information contained in this website is not intended to constitute, and should not be construed as, investment advice. No representation or warranty, express or implied, is given by any person as to the accuracy or completeness of the information and no responsibility or liability is accepted for the accuracy or sufficiency of any of the information, for any errors, omissions or misstatements, negligent or otherwise. Any views and opinions, whilst given in good faith, are subject to change without notice.
This is not an official confirmation of terms and is not a recommendation, offer or solicitation to buy or sell or take any action in relation to any investment mentioned herein. Any prices or quotations contained herein are indicative only.
Kepler Partners LLP (including its partners, employees and representatives) or a connected person may have positions in or options on the securities detailed in this report, and may buy, sell or offer to purchase or sell such securities from time to time, but will at all times be subject to restrictions imposed by the firm’s internal rules. A copy of the firm’s Conflict of Interest policy is available on request.
Leave a Reply
You must be logged in to post a comment.