Mar
2023
Solving the Rubik’s Cube: Investment Trust Ratings 2023
DIY Investor
8 March 2023
We reveal the winners of our investment trust ratings for 2023…by Thomas McMahon
Kepler’s investment trust ratings seek to identify the top-performing closed-ended funds in the Growth, Income & Growth and Alternative Income categories.
Our ratings are designed to capture attractive and persistent performance characteristics and to reward long-term success. In our view, quantitative ratings have value in drawing attention to the outstanding performers and can be a useful filtering tool.
However, any process should consider qualitative factors and potential future correlations, too. We stress that our screens are purely quantitative, so allow us to set aside all personal biases and views – and all commercial relationships – and look at the universe in a purely objective way.
‘Of the fifty-one trusts awarded a rating this year, only 59% of the trusts are clients of Kepler Trust Intelligence’
Of the fifty-one trusts awarded a rating this year, only 59% of the trusts are clients of Kepler Trust Intelligence. This is up from last year’s 48%, but this is incidental and is perhaps a reflection of the growing number of trusts which are our clients.
Our three categories are intended to fit three common objectives for investors: capital growth, a growing income from a portfolio with capital growth potential, and a high income.
This year’s winners of the ratings are presented below, along with a discussion of how last year’s rated trusts performed.
Our methodology
To identify the top growth trusts, we start by looking at performance versus the benchmark.
For us, the information ratio is the key metric. This looks at the outperformance of a fund versus its benchmark and then relates this to the extent of divergence from the benchmark or the extra risk taken.
In other words, it seeks to identify whether the active risk relative to the benchmark taken by the manager has been rewarded with outperformance.
We then look at the performance of a fund in rising markets versus its performance in falling markets – the upside/downside capture ratio. We think this has two attractions.
The first is that it reflects the ‘loss aversion’ of the average investor. Behavioural finance teaches us that investors prize avoiding loss more than they do achieving a quantitatively equivalent gain. This is captured by an upside/downside capture ratio above one, which means that the fund has a tendency to avoid losses by a more significant degree than it makes gains in rising markets.
‘the information ratio is the key metric’
The second attraction is that it allows us to consider defensive and aggressive strategies on a more level playing field. A trust which does exceptionally well in rising markets and is level in falling markets could rank the same as a trust which protects very well in falling markets but only keeps up in rising markets.
In order to create fair comparisons between funds, we have divided our universe into ‘super sectors’ of asset classes: large and mid-cap equity funds, small cap funds, fixed income or equivalent funds and property funds.
This is intended to reflect the fact that generating alpha, in particular, is much easier in small caps, so comparing small cap managers with large cap managers is unfair.
It also overlooks the risks that small caps bring, such as volatility and illiquidity, which means that it is not inherently superior to large-cap investing despite the advantages with regard to alpha. We rank trusts within their ‘super sector’ on all quantitative metrics.
In order to reward persistence, we review performance over a five-year time period, which makes it much harder for a single year to distort results. We also exclude trusts which have had a manager change in the past three years.
‘we review performance over a five-year time period, which makes it much harder for a single year to distort results’
It perhaps goes without saying that all our analysis is based on NAV total return performance, which reflects the strategy and decisions made by the manager, rather than share price, which can reflect many other factors.
As already discussed, we would never envisage such a rating being used on its own to determine investment decisions. Clearly, with investment trusts, the discount of the shares to NAV and the policies and the quality of the board all need to be considered too.
As importantly, given that quantitative studies are backward-looking, investors need to make a judgement about the likelihood of past performance patterns persisting in ever-changing markets. By looking over a long time period, we hope to capture a broader set of market conditions, but some trends last for much longer than five years.
For our income and growth ratings, we start with the screens used for the growth ratings. We then look at current yield and dividend growth, over five years.
To win the rating, a trust needs to have a 3% yield and 3% per annum dividend growth over the past five years as a minimum, allowing for high-yielding funds and dividend-growth funds to be considered together.
‘trusts in the infrastructure, renewables and related sectors are held for a stable and high income’
Given the lower number of trusts which hit this boundary, we have been more relaxed in our total return screens, not insisting on our minimum target for the information ratio as we have for the growth trusts, but simply ranking the trusts in the relevant ‘super sector’.
Once we have screened out the trusts which don’t meet the yield and dividend growth tests, we order the trusts by their quantitative score on our growth screens. We apply the same manager tenure screen.
We have also introduced an alternative income rating in order to analyse the top performers in this relatively new and rapidly growing space.
We think, for the most part, trusts in the infrastructure, renewables and related sectors are held for a stable and high income, most likely by those living off their income. High yield is likely more important than income growth.
We have developed a simple screen which shows those trusts which have at least maintained their NAV and their dividend, in nominal terms, over the past five years. With the alternative income space being relatively young, there are not many trusts with a long track record and just applying these two screens whittles the space down considerably.
Performance of 2022 lists
The aim of our ratings is to reward long-term performers and if there is any informational content in the winners of the rating, it would be seen over a long holding period. Nonetheless, it is interesting to see how last year’s rated trusts have done in a tumultuous period.
2022 was a year of regime change. Over the previous two years, it had been trusts with a growth style of investing which had excelled, while value-tilted trusts, often those with an income remit, were struggling to keep up with their benchmarks while delivering a decent yield.
‘this reversed in 2023 and growth trusts struggled while value trusts had the wind behind them’
However, this reversed in 2023 and growth trusts struggled while value trusts had the wind behind them. This means that performance has largely been better for the income & growth trusts, which includes more trusts with a value tilt and/or which invest in energy and miners, which were the sectoral winners.
However, even our income & growth shortlist contains some trusts with a stronger growth tilt, whether that be due to a structure that allows paying a dividend from capital or due to investing in smaller companies. This could be useful information for investors considering the possibility that 2023 will see a rebound in growth once more.
Turning first to the income & growth trusts, they generated an average loss of 3.3% in NAV total return terms, not bad given the carnage in many markets.
‘these are all trusts with excellent track records which we believe could do very well’
Nine of the 18 trusts which survived generated a positive return. On average, the trusts marginally outperformed their benchmarks. Notably, those that did better had a lower growth/value score.
This is our own internal metric which we calculate by adjusting the style score which Morningstar gives the portfolio for the consistency of the style allocation over time and the dispersion of the style bias across the portfolio.
A lower score means a greater tilt to value and those that have done better in absolute terms are, on the whole, those with a lower score than average. The worst performers for the year were those with exposure to the UK small-cap space. These tend to be more value-tilted than the average small cap trust, which makes sense considering their income objectives, but the market is certainly a growth market in the eyes of most investors and one that is likely to be sold down when risk aversion is high.
Poor performance over one year is nothing to be too concerned about, in our view, and these are all trusts with excellent track records which we believe could do very well when their corner of the market comes back into favour.
Performance of 2022 Income and Growth Rated Trusts
| Trust | Calculation Benchmark | Return | Excess Return | G/V Score | Quality Score |
| BlackRock Latin American | MSCI EM Latin America NR | 14.71 | -7.94 | 0.16 | 5.2 |
| Murray International | MSCI ACWI NR | 7.79 | 15.87 | 0.75 | 5.6 |
| North American Income Trust | Russell 1000 TR | 7.25 | 16.19 | 2.00 | 5.1 |
| Schroder Income Growth | FTSE AllSh TR | 3.67 | 3.33 | 0.38 | 5.1 |
| BlackRock Sustainable American Income | Russell 1000 TR | 2.98 | 11.92 | 0.47 | 5.2 |
| City of London | FTSE AllSh TR | 2.78 | 2.44 | -0.41 | 5.8 |
| Utilico Emerging Markets | MSCI EM NR | 2.64 | 12.66 | 1.00 | 10 |
| Henderson International Income | MSCI World High Dividend Yield NR | 0.91 | -6.35 | 0.50 | 4.6 |
| BlackRock Income and Growth | FTSE AllSh TR | 0.22 | -0.12 | 0.62 | 5.5 |
| abrdn Equity Income Trust | FTSE AllSh TR | -2.21 | -2.55 | 1.40 | 5.9 |
| JPMorgan Global Growth & Income | MSCI ACWI NR | -2.56 | 5.52 | -0.20 | 4.6 |
| Law Debenture Corporation | MSCI ACWI NR | -7.20 | 0.88 | 1.53 | 5.3 |
| JPMorgan Claverhouse | FTSE AllSh TR | -7.84 | -8.18 | 0.55 | 5.5 |
| Lowland | FTSE AllSh TR | -8.38 | -8.71 | 3.05 | 5.1 |
| CT Global Managed Portfolio Income (formerly BMO Managed Portfolio) | Morningstar UK Adv Tgt Alloc NR | -12.55 | -6.70 | 4.22 | 5.7 |
| Diverse Income Trust | FTSE Small Cap Ex Invest Trust TR | -13.58 | 3.73 | 0.41 | 6.4 |
| Chelverton UK Dividend Trust | FTSE AllSh TR | -19.71 | -20.05 | -0.48 | 5.8 |
| Montanaro UK Smaller Companies | FTSE Small Cap Ex Invest Trust TR | -27.71 | -10.40 | -4.81 | 3.4 |
| AVERAGE | -3.27 | 0.09 | 0.62 | 5.5 |
Source: Morningstar, Kepler calculations, 01/01/2022 – 31/12/2022
Past performance is not a guide to future returns
We note that during the year, JPMorgan Russian Securities (JRS) saw its shares suspended after the invasion of Ukraine and was later renamed JPMorgan EM Europe Middle East and Africa (JEMA), the NAV being written down by 95%.
We have removed it from the table, given the special circumstances. Meanwhile, JPMorgan Elect Managed was bought by JPMorgan Global Growth & Income (JGGI), another rating winner. As a result, the list shrank by two trusts over the year.
Amongst the growth-rated trusts, it was also, unsurprisingly, those with a greater tilt to value which did better: Fidelity European (FEV), abrdn Asian Income (AAIF), Finsbury Growth & Income (FGT) and Scottish American (SAIN) all limited losses to single digits in percentage terms.
‘it was also, unsurprisingly, those with a greater tilt to value which did better’
However, on average, the trusts lost 25.3% and underperformed their benchmarks by 13.7%. The average growth score is considerably higher than the income & growth trusts’ and the poor performance reflects a dire year for equities, thanks to historically rapid rate hikes.
We don’t see any pattern in the quality score, this being another internal metric, for either list. However, we suspect this may be a more important guide to relative performance in 2023 than it was in 2022, with the growth/value distinction less important.
Performance of 2022 Growth Rated Trusts
| Trust | Calculation Benchmark | Return | Ecess Return | G/V Score | Quality Score |
| Fidelity European Trust | MSCI Europe Ex UK NR EUR | -4.09 | 3.54 | 2.8 | 5.5 |
| abrdn Asian Income Fund | MSCI AC Asia Pacific ex Japan HDY NR USD | -4.41 | -6.96 | 0 | 6.6 |
| Finsbury Growth & Income | FTSE AllSh TR GBP | -6.84 | -7.18 | 1.8 | 5 |
| Scottish American | Morningstar UK Adv Tgt Alloc NR GBP | -7.17 | -1.33 | 2.2 | 4.5 |
| JPMorgan Emerging Markets | MSCI EM NR USD | -13.31 | -3.29 | 3.8 | 4.6 |
| Pacific Horizon | MSCI AC Asia Ex Japan NR USD | -21.95 | -12.39 | 2.2 | 7 |
| JPMorgan China Growth & Income | MSCI China NR USD | -22.94 | -10.85 | 4.4 | 5.6 |
| Baillie Gifford Shin Nippon | MSCI Japan Small Cap NR JPY | -23.37 | -22.40 | 4.7 | 7.7 |
| Fidelity Japan Trust | TOPIX TR JPY | -24.30 | -20.15 | 4.5 | 5.1 |
| JPMorgan Japan Small Cap G&I | MSCI Japan Small Cap NR JPY | -25.39 | -24.42 | 4.6 | 6 |
| BlackRock Greater Europe | MSCI Europe Ex UK NR EUR | -26.42 | -18.80 | 4.6 | 4.3 |
| JPMorgan UK Smaller Companies | FTSE Small Cap Ex Invest Trust TR GBP | -28.44 | -11.14 | 4.8 | 5.5 |
| JPMorgan Japanese | TOPIX TR JPY | -28.93 | -24.79 | 4.8 | 4.6 |
| Montanaro European Smaller | MSCI Europe ex UK Small Cap NR EUR | -30.60 | -14.50 | 4.8 | 6.5 |
| TR Property | FTSE EPRA Nareit Developed Europe TR EUR | -33.05 | -0.10 | 1.4 | 7.7 |
| Allianz Technology Trust | MSCI World/Information Tech NR USD | -33.12 | -11.05 | 3.9 | 4.5 |
| Edinburgh Worldwide | MSCI ACWI SMID NR USD | -34.00 | -25.51 | 4.9 | 9.3 |
| BlackRock Throgmorton Trust | FTSE Small Cap Ex Invest Trust TR GBP | -35.21 | -17.90 | 4.2 | 4.6 |
| River and Mercantile UK Micro Cap | FTSE Small Cap Ex Invest Trust TR GBP | -40.20 | -22.90 | 2.5 | 4 |
| Scottish Mortgage | MSCI ACWI Growth NR USD | -41.36 | -21.74 | 5.8 | 5.5 |
| AVERAGE | -24.25 | -13.69 | 3.64 | 5.71 |
Source: Morningstar, Kepler calculations, 01/01/2022 – 31/12/2022
Past performance is not a guide to future returns
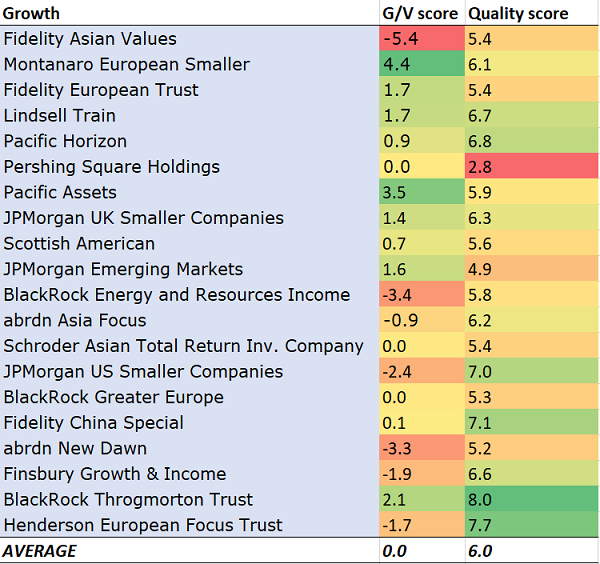
Revealing the 2023 list of top-rated trusts for growth
The 2023 growth rated trusts are listed below, along with their style scores for growth versus value and for quality.
Only the 20 top scorers on our underlying screens have been awarded a rating. Notably, the average growth score of the trusts awarded a rating has fallen from 3.6 last year to 0.0 this year.
This reflects a few things: value-tilted trusts doing better, some managers deliberately shifting more into cheaper companies, and the effect of a sell-off on valuations which brings down the growth scores of expensive companies.
‘there is a good spread of approaches across the growth/value spectrum on our list, thanks to the long-term focus of our ratings’
Nonetheless, there is a good spread of approaches across the growth/value spectrum on our list, thanks to the long-term focus of our ratings.
More value-exposed trusts include Fidelity Asian Values which had the highest underlying raw rating, BlackRock Energy & Resources Income (BERI) and abrdn New Dawn (ABD). More growth-exposed trusts include Montanaro European Smaller Companies (MTE), Pacific Assets (PAC) and BlackRock Throgmorton (THRG).
Interestingly, there is also an increase in the average quality rating for the growth rating and income & growth rating winners. We suspect this reflects a consensus on the part of managers that quality companies are likely to do better in the rough economic environment we are entering.
2023 Growth Rated Trusts
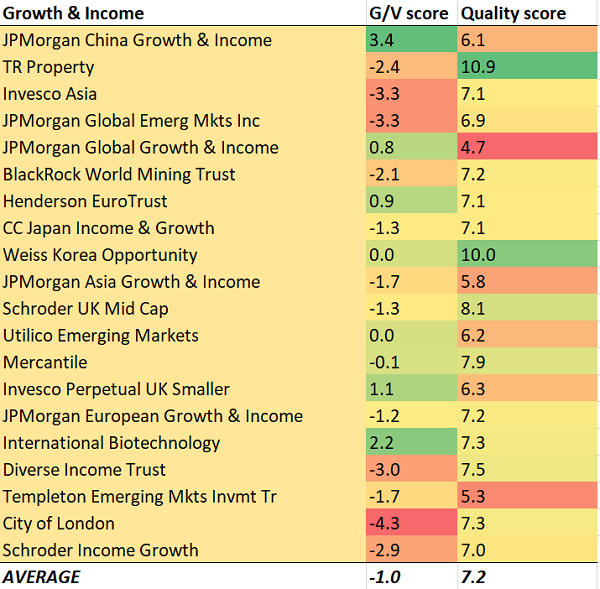
Revealing the 2023 list of top-rated trusts for income & growth
The 20 top-rated trusts for income & growth are listed below. As a reminder, these are the trusts which score the highest on our quant screens, while delivering a yield of at least 3% and growth of their dividends by at least 3% per annum, over the past five years.
There has been a modest further tilt towards value over the past year, judging by the average growth/value score.
However, JPMorgan China Growth & Income (JCGI) and International Biotechnology Trust (IBT) both offer growth-focussed portfolios, using an ability to pay dividends from capital to generate a high and growing income too. We would note there are also a number of trusts focussed on the UK small and mid-cap space which may have more of a value tilt than their peers, but which, by virtue of investing in those markets, have high growth potential: Schroder UK Mid Cap (SCP), Invesco Perpetual UK Smaller Companies (IPU) and Diverse Income Trust (DIVI).
2023 Growth & Income Trusts
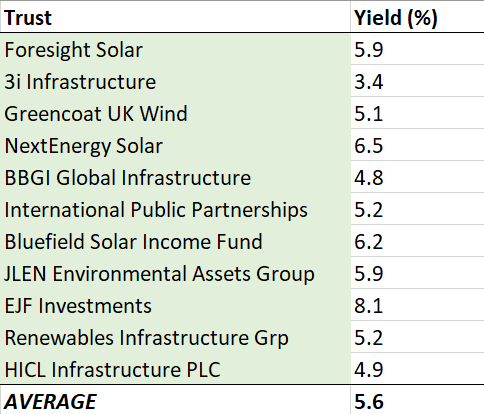
Revealing the 2023 list of top-rated trusts for alternative income
The alternatives space has seen huge growth in recent years. While our NAV-based screens can’t be usefully applied to them, we do want to try to identify those which have proven their worth over the long run.
In our view, these are largely held for yield, with capital growth being a secondary consideration. We think they are likely held by most investors to provide a high income, whether that is to be drawn down or as a lower volatility return stream.
‘these are largely held for yield, with capital growth being a secondary consideration’
We have therefore filtered the alternatives space by two basic requirements: which trusts have managed to maintain or grow their NAV while maintaining or growing their divided over the past five years.
It is a short list, with many trusts not having the track record to qualify. This year we have identified 11, which we list below, along with their current yields (according to Morningstar).
With one exception, all offer high yields of 5% or more, which we think continues to be attractive. While bond yields did rise considerably over 2022, in our view, the peaks for government debt yields may have been seen and the yields shown below are likely to be attractive if dividends can be maintained.
What we cannot bring into a quant screen like this is an estimate of how a higher interest rate environment will affect the NAV values and the income potential of these trusts. This is going to be an issue the sector will have to work through over 2023.
2023 Alternative Income Trusts
Conclusions
Our ratings are designed to reward trusts which have delivered the characteristics we believe investors ask for of a long-term investment.
The three ratings are aimed at different core goals: long-term growth, income and growth and high and stable income.
Any fund selection process could only begin with such a series of screens and there are many hidden risks and factors to consider, but we think it could be a good starting point for idea generation.
‘reward trusts which have delivered the characteristics we believe investors ask for of a long-term investment’
The innate flaw of quant systems is that they inevitably favour what has worked in the past. However, we have tried to balance this tendency in a number of ways.
First, we have attempted to reward those trusts which have done well in the context of their own goals and benchmarks, rather than versus a peer group.
Secondly, we have used a long, five-year period for measurement, hoping to capture performance in a variety of conditions.
‘there are many hidden risks and factors to consider, but we think it could be a good starting point for idea generation’
Thirdly, we have also developed a system for measuring some key stylistic factors – growth, value and quality – which can be considered alongside the ratings to build a picture of how trusts might correlate or not.
We believe that the trusts which have won a rating this year show a useful diversity of style and strategy.
As a final note, we have not considered share price performance in our ratings. While this can be an extra source of return or loss, we believe NAV performance will be the focus of long-term investors, and the longer a holding period, the more important it will be compared to share price as a source of return.

Disclaimer
This is not substantive investment research or a research recommendation, as it does not constitute substantive research or analysis. This material should be considered as general market commentary.
Alternative investments Commentary » Alternative investments Latest » Commentary » Investment trusts Commentary » Investment trusts Latest » Mutual funds Commentary » Take control of your finances commentary
Leave a Reply
You must be logged in to post a comment.