Feb
2024
Range anxiety
DIY Investor
10 February 2024
We look at what context we can get from ten years of discount analysis…by Ryan Lightfoot-Aminoff
Discounts are one of the most defining features of investment trusts and a key differentiator to other investment vehicles. Following a particularly challenging 2023, discounts have blown out almost across the board leading investors to debate which pool of assets they should buy for below their underlying value. The Z-score is a popular statistical tool for identifying value, but we believe it has lost context when everything is so depressed. In the article below, we have analysed ten years’ worth of discounts to not only establish what sectors are cheap, but whether a narrowing discount will actually drive future returns.
The stats
It won’t surprise many people that investment trusts are currently cheap versus their own history. One tool often used to assess value in discounts is the Z-score. This is a statistical metric that shows the relationship between specific values and the average to demonstrate how statistically anomalous the measured value is. When applied to investment trusts, the lower the Z-score, the wider the current discount is to its historic average, ergo the shares are cheaper. On the other hand, the higher the score, the more expensive the current discount level. For the UK equity income sector, the aggregate discount is 4.8%, over one standard deviation wider than the ten-year average with a Z-score of -1.18. However, the standard deviation is very low at 1.5 percentage points, which means should the discount narrow from its current level to its ten-year average, it would add just 1.8 percentage points to NAV returns. This is not to discredit an additional 180bps of alpha; if the discounts narrowed back to their long run average, this would contribute a useful additional return over investing in a passive fund, on top of the potential alpha from active management.
However, by simply focussing on the Z-score, the context of how much a narrowing discount can potentially add to performance is lost. To see how Z-scores overlook the scale of the opportunity, contrast the UK equity income sector to the UK commercial property sector. The UK commercial property sector has a similar Z-score of -1.08, possibly suggesting that it is slightly less attractive than UK equity income. However, one standard deviation of the sector’s average discount is 11.5 percentage points, over seven times that of UK equity income over the same period. If the average discount of the UK commercial property sector were to narrow from its current level of 17.7% to its own ten-year average of 5.2%, it would contribute 15% of alpha for investors, assuming that NAVs remain flat. This means that whilst the Z-scores may indicate a similar level of attractiveness in the discount, in our view, the UK commercial property sector offers considerably more upside potential from a narrowing discount.
In the table below, we have taken ten years’ worth of discount and premium history for each investment trust sector average before performing some rudimentary statistical analysis. The aim is to show the scale of how discounts have moved over ten years. We believe this helps provide better context to the current discount, more than just whether it is cheap or not relative to its own short-term history. The inference of this is that looking forward, we can make a judgement of whether the narrowing of the discount will have a material impact on returns going forward.
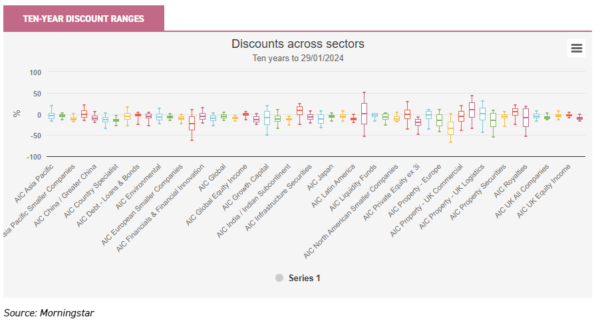
In the box and whisker plot below, we have shown the maximum and minimum discount levels of each sector average, with the boxes showing the one standard deviation range, and the mean average marked by the bar in the middle of this. This shows the full range in which each sector has traded in the period, as well as the most common trading range, and compares this across all sectors and assets. If our analysis is correct, bargain hunters should be focussing on sectors which have the largest whiskers, but specifically those in which the box is towards the lower end of the range.
One trust in the UK Equity Income sector this analysis suggests as offering a good discount opportunity is BlackRock Income and Growth (BRIG). Managers Adam Avigdori and David Goldman look to deliver capital and income over time through a concentrated portfolio of predominantly UK companies. They have a focus on companies exhibiting quality characteristics, such as free cash flow, which allows firms to pay a growing dividend. The shares of the trust are currently trading at a wide discount to their ten-year history, at a level of 11.4% compared to a ten-year average of 4.7%, a much larger absolute gap than the average of the sector. We believe the discount looks anomalously wide at the current levels and could contribute to significant alpha should it narrow to its long-term mean.
In the property space a trust that jumps out is Balanced Commercial Property (BCPT). It currently trades at a discount of 33.2% versus a ten-year average of 12% which offers a 33% upside should the discount narrow to the long-term average. The trust is managed by Richard Kirby who has been in place since 2005, offering experience in a variety of different environments. He has a diversified underlying portfolio which he has built through active management. In the last couple of years, he has rotated the portfolio away from office and retail exposure and towards industrials and logistics. We believe this activity has demonstrated value in the portfolio, thus making the current discount look particularly compelling.
Most real asset sectors have wider discount ranges than equities, with wide ranges across almost all of the subsectors. Exceptions to the rule, that equity sectors have narrower discount ranges, are the Asian sectors. The AIC Asia Pacific sector for example is trading at a discount of 9.1%, versus a ten-year average of 4.7%. This is a gap of 4.5 percentage points, and considerably wider than the gap between the UK equity income’s current and average of 1.7 percentage points. As such, the Asia Pacific sector could contribute significant alpha should this discount level close. There is a similar trend in the Asia Pacific Equity Income and Asia Pacific Smaller Companies sectors too. We believe the negative sentiment towards China will be weighing on this, with the zero-covid policies enacted up until late 2023 causing significant harm to the economy. However, there are a number of trusts that invest in the region but are avoiding China, yet have been caught up in the negative narrative. One example is Schroder Oriental Income (SOI). Managed by Richard Sennitt, it owns a portfolio of predominantly large-cap companies that Richard identifies through a bottom-up process that looks to capture the improving dividend culture in the region. He has been underweight China for a sustained period due to structural concerns over the country, ranging from the housing sector to political interference. This has contributed to significant outperformance of the benchmark over a number of time periods. Despite this, the trust trades at a discount of c. 6.2%, wider than its ten-year average of 1.9%. Should this discount return to just the long-term average, it would contribute 4.6% to returns ceteris paribus. We believe this may prove an attractive entry point for long-term investors and appeal to those liking the structural growth story of Asia but with concerns over China.
As well as specific trusts, the data also points to a number of interesting sectors. Renewable energy infrastructure stands out. It has one of the widest ranges in the data set, though the one standard deviation range is close to the maximum values seen in the period. This indicates that there are a few outliers towards the lowest end of the data range. However, the current average discount of 18.5% is one of the outliers, being close to the lowest end of the ten-year range, as we show below. This is trumped by biotech and healthcare though, where the average discount for trusts in this sector is at their ten-year lows at the time of writing. In the table below, we show the sectors we believe stand out in terms of the current discount versus their long-term averages and compare their Z-scores. We also show the ten-year discount range, measuring the difference between the highest average premium achieved during this period, and the widest discount. In our view, this illustrates the scale of the potential discount opportunity, if history repeats itself.
NOTABLE SECTOR DATA
| SECTOR | 10-YR AVERAGE % |
CURRENT DISCOUNT % |
10-YR RANGE % |
STANDARD DEV |
Z-SCORE |
| AIC Property – UK Commercial | -5.2 | -17.7 | 58.0 | 11.5 | -1.1 |
| AIC Property – UK Residential | -14.8 | -45.7 | 62.9 | 15.7 | -2.0 |
| AIC UK Equity Income | -3.1 | -4.8 | 13.0 | 1.5 | -1.2 |
| AIC Asia Pacific | -4.6 | -9.2 | 36.5 | 6.3 | -0.7 |
| AIC Renewable Energy Infrastructure | 5.1 | -18.6 | 45.0 | 8.0 | -2.9 |
| AIC Biotechnology & Healthcare | -0.2 | -16.4 | 37.5 | 7.4 | -2.2 |
Source: Morningstar as of 29/01/2024
Peak-ing the interest
One broad feature of the data is that equity sectors have considerably narrower ranges than real asset classes such as property. We believe one contributor to this is the confidence investors can have in underlying values. Equities are publicly traded and therefore price discovery is easily determined. As such, discounts have remained within a fairly narrow range as investors have been easily able to determine whether they offer value. Conversely, more esoteric or newly established areas such as infrastructure and renewable energy have had bigger discount ranges with one potential reason being that investors may doubt the value of assets at times, especially if there are few comparable transactions of size being reported.
Another key factor is the changing interest rate environment. The period we have analysed includes a significant amount of time where interest rates were at or close to zero. This had a significant impact on all asset classes but especially real asset classes such as property due to how these assets are typically valued, as well as their use of leverage. When interest rates were low, the yield investors could get from safe assets was relatively low. As a result, investors were more willing to accept lower yields from real assets, contributing to many trusts trading on a premium. As interest rates have risen, investors have returned to the likes of government bonds which are now delivering a higher yield. As such, many of the property and infrastructure trusts have moved to significant discounts. Furthermore, the high level of leverage often involved means the potential for a higher interest cost burden has raised questions over dividend sustainability. Whilst this has been a headwind, consensus is building that interest rates have peaked, and that monetary policy could turn from a headwind to a tailwind. If this were to be the case, we believe it could be the catalyst for considerable discount narrowing in these sectors. With discount levels where they are, this could make for a compelling entry point.
Conclusion
Exploiting discounts can be a way to generate additional alpha and, for contrarians, can at times signal compelling entry points for investment trusts. It is often one of the key attractions of investing in the asset class and a strong driver of potential returns. Whilst using common statistics such as Z-scores makes for a straightforward analysis tool, we believe our range analysis helps to provide context and illustrate the upside to the opportunity, rather than simply identifying the opportunity itself.
With this in mind, we believe areas such as property, renewable energy infrastructure, and Asian equities look particularly compelling, given their discounts are significantly wider versus their long-term history, and offer considerable upside should they narrow. Each is facing their own headwinds which has pushed them to wide discounts, but the scale of any bounce back could contribute to a bonanza of excess returns should they come.

Disclaimer
This is not substantive investment research or a research recommendation, as it does not constitute substantive research or analysis. This material should be considered as general market commentary.
Leave a Reply
You must be logged in to post a comment.