Jul
2023
Many hands make light work
DIY Investor
13 July 2023
We break down how multi-managers have performed over the past five years and their positioning for the inevitable uncertainty that lies ahead…by Nicholas Todd
It is hard to escape the fact that the performance of key equity markets over the past several years has been volatile. The uncertainty created by the coronavirus pandemic, the dramatic reopening, the ongoing Russia-Ukraine war, and the battle to contain inflation has made it difficult for investors to know where to put their money.
While investors can simply duck the issue by hiding in cash accounts, professional managers have to meet these challenges head-on. The managers of multi-manager trusts have by and large done a good job in that regard, as we discuss below. Arguably they have proven their worth as core investment propositions which seem set up for what looks likely to be continued volatility and a period in which style rotation will be less extreme.
Performance
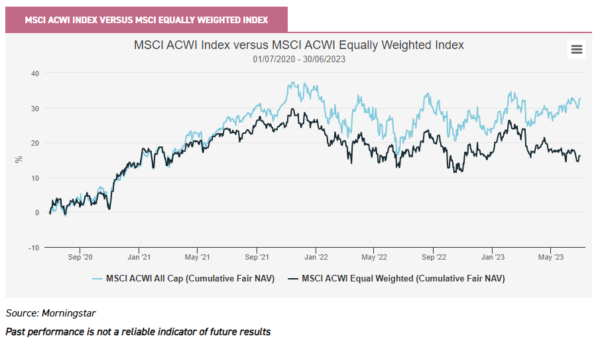
Over the past several years it has been difficult for active managers to outperform the market. There has been a brutal style rotation and for much of the period, a relatively small number of large caps driving the performance of major indexes. We believe this is best demonstrated by the significant outperformance of the market cap-weighted MSCI ACWI Index versus the equally weighted version of the index, as shown in the chart below.
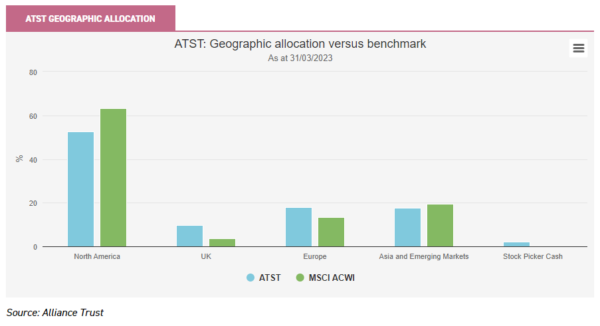
Despite these difficulties, there has been some good performance from multi-manager trusts, which we believe highlights their attraction as a core holding. For example, Alliance Trust (ATST), which is managed by the global consultancy Willis Towers Watson (WTW), has performed well over the last three years with its stylistically neutral strategy demonstrating value through its outperformance of the MSCI ACWI Index benchmark.
The trust saw a greater contribution to performance from value-focussed managers over the second half of the period offsetting the impact from the growth-focussed managers in the portfolio which were impacted by rising inflationary pressures and interest rates.
This led to a higher level of volatility, however, the returns generated led to better risk versus reward characteristics as measured by the Sortino ratio (we have used this over Sharpe as it doesn’t punish upside volatility).
Three-year performance
| INVESTMENT TRUST | THREE-YEAR NAV TOTAL RETURN (%) | VOLATILITY (%) | SORTINO RATIO | MAX DRAWDOWN (%) | CORRELATION | BETA | ALPHA |
| ATST | 35.23 | 12.92 | 0.80 | -12.38 | 0.98 | 1.09 | -0.14 |
| FCIT | 29.38 | 11.50 | 0.75 | -11.24 | 0.99 | 0.98 | -0.77 |
| WTAN | 30.09 | 13.70 | 0.69 | -17.38 | 0.96 | 1.11 | -1.60 |
| CMPG | 4.51 | 13.36 | 0.10 | -24.48 | 0.93 | 1.02 | -8.14 |
| CMPI | 11.16 | 11.90 | 0.26 | -16.38 | 0.92 | 0.95 | -5.62 |
| Benchmarks | |||||||
| iShares MSCI ACWI (global equity index) | 33.15 | 11.80 | 0.82 | -10.84 | |||
| FTSE All- Share (UK equity index) | 33.19 | 12.92 | 0.80 | -9.22 |
Source: Morningstar, as at 30/06/2023, calculation benchmark MSCI ACWI Index
Past performance is not a reliable indicator of future results
Although F&C Investment Trust (FCIT) and Witan (WTAN) have underperformed over this period in terms of NAV total returns, we note if we were to look on a cum fair NAV basis, which takes into account the fair value of debt as well as investment returns, these trusts have also outperformed the benchmark.
(We have considered debt at par in the above table to isolate investment returns and allow for the calculation of meaningful other performance characteristics.) FCIT also had the lowest maximum drawdown versus the other trusts and the lowest volatility versus both the trusts and benchmarks measured here. We believe this can be attributed to the FCIT’s higher level of diversification and similarities in terms of underlying regional exposure with the benchmark over this period.
On the other hand, WTAN had the highest volatility amongst this peer group. In our view, this can be partly attributed to the trust’s overweight allocation to the UK, which is reflected in its official benchmark: 85% of the MSCI ACWI Index and 15% of the MSCI UK Investable Market Index.
The sharp increase in inflationary worries at the start of 2022 also impacted the prospects for WTAN’s high-growth managers with gearing also exaggerating the drawdown. Despite this the trust has performed relatively well, aided by the opportunistic active management style and allocations to a small portfolio of specialist investment trusts.
We have also included CT Global Managed Portfolio Trust (CMPG/CMPI) which is managed by Peter Hewitt. The trust is benchmarked against the FTSE All-Share Index, for comparison purposes for its predominantly UK investor base, with Peter maintaining a benchmark-agnostic mindset. The trust offers investors the option to shift between two share classes for their specific requirements: CMPG is a strategy focussed on capital growth while CMPI targets income.
Over this period, CMPG and CMPI’s performance has lagged global and UK indices, however, this may be unsurprising given the longer-term underperformance of the UK market; CPMG and CPMI allocate 32% and 41% respectively to UK equities. We note that the difference in the UK allocation has contributed to CMPI’s outperformance of CMPG, with better risk/reward characteristics benefiting from the cyclical rally that took place over 2022.
Peter has reduced his exposure to growth strategies in CPMG and increased his allocation to value and the UK, but he has held on to significant holdings in growth, arguing that over the long term, these strategies should once more add value (as they did from 2016 to 2020, for example). We note the greater allocation to the UK from both the executive team at WTAN and from Peter reduces the overall correlation with the MSCI ACWI, particularly over the longer term.
One-year performance
| INVESTMENT TRUST | ONE-YEAR NAV TOTAL RETURN (%) | VOLATILITY (%) | SORTINO RATIO | CORRELATION | BETA | ALPHA |
| ATST | 15.06 | 14.81 | 1.14 | 0.99 | 1.11 | 2.18 |
| FCIT | 7.59 | 12.47 | 0.65 | 0.99 | 0.97 | -3.22 |
| WTAN | 11.71 | 14.12 | 0.91 | 0.98 | 1.04 | -0.09 |
| CMPG | -1.52 | 13.63 | -0.05 | 0.91 | 0.94 | -11.68 |
| CMPI | -5.23 | 11.85 | -0.31 | 0.88 | 0.87 | -14.89 |
| Benchmarks | ||||||
| iShares MSCI ACWI (global equity index) | 11.48 | 12.88 | 0.94 | |||
| FTSE All-Share (UK equity index) | 7.89 | 13.91 | 0.60 |
Source: Morningstar, as at 30/06/2023, calculation benchmark MSCI ACWI Index
Past performance is not a reliable indicator of future results
Over the past year, ATST outperformed the global index and the FTSE All-Share Index, its stylistic neutrality helping it to generate positive alpha. The trust’s beta to the benchmark has also remained high alongside its volatility, however as with the three-year performance the Sortino ratio demonstrates a strong risk versus reward payoff. We believe the relatively high volatility compared to FCIT can be attributed to the higher allocation to growth and the higher concentration of individual holdings across the portfolios.
WTAN’s short-term performance has also been good, however, the highly active management style of the executive team, demonstrated by the 79% active share, has led to greater volatility than the index.
During the period, they looked to generate value through the opportunistic purchase of long-dated gilts following the spike in yields that followed Kwasi Kwarteng’s ill-fated mini budget. With yields of more than 5%, compared to Witan’s fixed borrowing of c. 3%, the team saw the opportunity for an attractive risk-free return. When yields reverted, they sold these bonds, taking significant capital gains.
FCIT’s lead manager, Paul Niven, has focussed more on preserving investors’ capital and reducing the volatility of returns. This has resulted in the lowest level of volatility amongst this group and one of the lowest in the global sector.
However, the gradual shift to a more core strategy has meant it has been difficult to outperform the narrow cohort of mega-cap tech stocks that have outperformed since Q4 2022. In a similar vein, CMPG and CMPI have also suffered with both share classes having been underweight the high-performing energy majors of 2022 in the UK, being underweight to mega-cap stocks in the US, and a relatively high 20% and 17% allocation to small and micro-cap stocks.
The use of investment trusts to construct the portfolio has also detracted with sector discounts widening significantly over 2022, particularly on the alternative trusts such as property, renewables, and infrastructure which experienced a sharp widening of discounts when bond yields moved sharply upwards following the September 2022 mini budget.
We would highlight though, that this factor works to investors’ advantage in bull markets, with narrowing discounts a powerful addition to NAV returns. With sentiment in markets seeming to be tentatively improving, there has to be a chance we are about to see a grinding in of discounts which could help CPMG.
Performance drivers/evolution of portfolio positioning
For ATST, WTW’s caution over the economic outlook and uncertainty around the future path of inflation and interest rates has resulted in a reduction in the growth allocation over the past financial year, specifically the allocation to Sands Capital. There has been a concomitant increase in the allocations to value-sensitive strategies such as Black Creek Investment Management and UK-centric Jupiter Asset Management. This has also resulted in an increase in the overweight in the UK of 6%, as shown in the chart below.
FCIT’s long-standing manager, Paul Niven, employs a more diversified strategy with over 400 individual holdings on a look-through basis compared to ATST’s 186. Over the past three years, Paul has been more active in his management of the portfolio, incorporating a combination of top-down and bottom-up factors in his allocation decisions.
Macroeconomic uncertainties have led him to take a more cautious approach across the board, the evolution of which is illustrated in the chart below. The less supportive environment for growth has led to a gradual rotation into more value and income-driven strategies, starting in Q4 2020.
This has seen the complete sale of the global small-cap allocation, and the rotation out of US growth into US value and US core strategies through manager Barrow, Hanley, Mewhinney, and Strauss, which performed particularly well in 2022, and an in-house Columbia Threadneedle strategy.
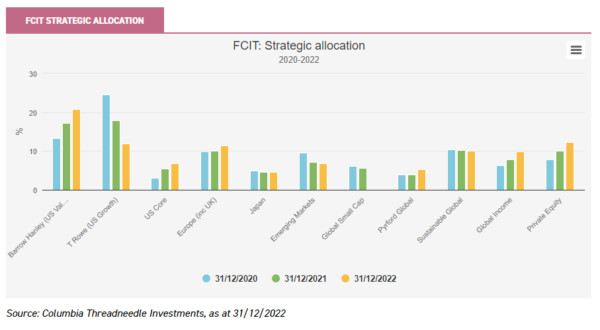
In addition, Paul sees greater value outside US equities which has seen cash from the sale of growth strategies allocated to more attractively valued areas of the market such as Europe and Emerging Markets – albeit at the margin. This has resulted in more equal distributions across specific risk factors, which is reflected in FCIT’s lower volatility over the past 12 months, and through its relative five-year performance characteristics discussed in our most recent note.
Paul’s allocation to private equity has increased from 7.9% to 12.3% over the past three years and provides access for investors to hard-to-reach, very early-stage growth companies. This allocation can present an opportunity to generate alpha, and over the 2022 financial year, it generated a return of 3.6% – outperforming its public equity equivalents in the portfolio.
Despite the board’s well-timed move to lock in a historically attractive fixed rate for borrowing, gearing is close to five-year lows. However, the facility does give Paul the flexibility to take advantage of cheap debt whenever he thinks the opportunity is there. In addition, towards the end of last year, Paul allowed cash to build up (currently at 5.9%) reducing the need for the board to renew the revolving credit facility.
WTAN predominately invests in large and mid-sized global companies. The evolution of the trust’s geographical exposure is shown below. The lag in the trust’s five-year performance can be partly attributed to the overweight allocation to the UK and Europe in the build-up to the pandemic. Since then, the UK allocation has steadily declined from 27% to 19%, with the allocation to Europe reduced significantly.
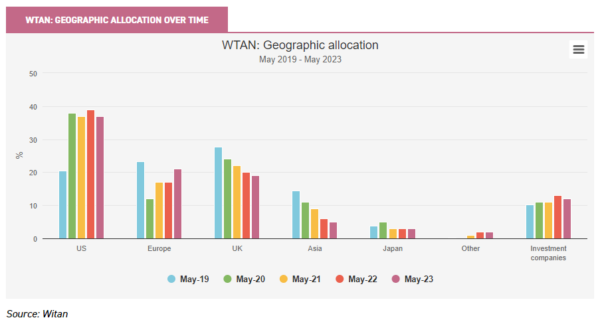
This made way for the executive team to introduce two new US growth managers, Jennison and WCM. The combination of these changes resulted in a significant increase in the US allocation, which has remained a dominating feature of the portfolio since then.
However, the entry into the positions has been more gradual than this chart suggests, as the executive team has been adding to the positions over time to gain exposure during weakness. Performance from growth-focussed managers such as Jennison has proven more positive this year, with tailwinds coming from the application of A.I. and the easing of rate expectations in the US having a positive effect on growth and technology indexes – the NASDAQ having a record-breaking first half of the year with gains of c. 40%.
The current allocation to core managers has a global focus, introduced following the pandemic to minimise overexposure to one sector, style, or theme. However, WTAN’s benchmark is a composite 85% to the MSCI ACWI and 15% to the MSCI UK Investable market index, with Artemis managing the core UK exposure. However, Artemis’s mid-cap bias has caused a drag on performance due to the underweight exposure to the oil and gas sector.
The team are confident that long-term structural growth trends will contribute positively to performance over the long term. The 25% allocation to specialist funds includes investment trusts whose underlying exposures are to emerging markets, climate change, private equity, commercial property, and life sciences. The team’s confidence is also represented through the historically high gearing of 15% which compares to the more cautious approach taken by ATST and FCIT.
CMPG/CMPI’s manager, Peter Hewitt, has been tactically adjusting both the income and growth portfolio since Q3 2021, placing a greater emphasis on the protection of investors’ capital. He reduced exposure to high-growth strategies in technology and biotechnology due to their vulnerability to de-rating in a high inflation and interest rate environment, in favour of those with more of a value bias.
This included Scottish Mortgage, Allianz Technology, Polar Capital Technology, and Herald each reduced by between a third and a half, with more value-focussed, and capital preservation strategies including Fidelity Special Values, Ruffer Investment Company, and Personal Assets Trust.
The allocation to large-cap growth holdings fell from c. 25% to c. 19% according to Morningstar. In addition, although the allocation to smaller growth companies has reduced, it remains significantly higher than the alternative trusts in this note, and over the course of 2023, Peter has been increasing the allocation to small-cap core funds from 8% to 13.5% to capture a potential recovery in UK medium and smaller companies. Unlike FCIT, Peter has kept his private equity allocation much the same as it was in 2020 for CMPG and CMPI at c.7% and 8% of assets.
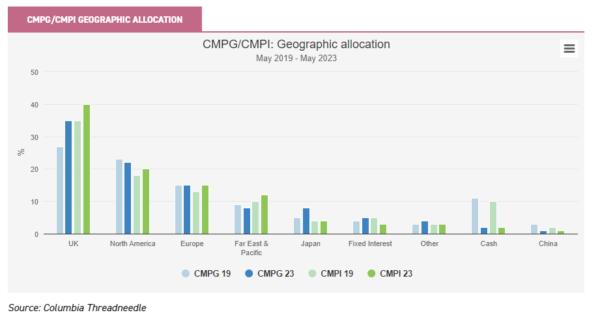
These moves are reflected in the geographic allocation chart below. Overall, there have been limited changes over the past three years, however, the proceeds from sales in high-tech were redeployed into investment companies invested in UK equities – further enhancing the value bias of the portfolio. This is particularly evident in the income portfolio, where the allocation to UK equity strategies, and those with a greater exposure to the cyclical rotation were increased including Law Debenture, City of London, Diverse Income Trust, etc. alongside a more defensive and capital preservation stance through trusts such as Capital Gearing and Personal Assets Trust. We would direct readers to our most recent note which highlights the changes made to the top ten positions in the 12-18 months up to the start of 2023.
Conclusion
The volatility experienced by financial markets over this period has made it difficult for investors to generate consistent excess returns. We think the merits of a core, stylistically neutral strategy have shone through in this environment. Multi-manager investment trusts offer flexible mandates which can balance exposures to offer the hope of generating alpha in multiple environments.
We would also add they have another benefit, which is outsourcing the decision to invest to someone else! Many of us can find it hard to stay invested when times are uncertain, and then hard to pick the moment to reinvest our cash, and letting someone else make the decision has its attractions.
Over the past three years, there has been on average a rotation out of growth and into value to create more stylistically balanced core strategies. Furthermore, managers have looked to re-balance their geographical allocations away from the expensive US market towards the more attractively valued UK and European equity markets.
However, across the board, the underlying focus seems to be on quality. Rather than chasing stylistic headwinds, all these trusts seek to identify specialist managers, with a focus on the fundamental quality of their underlying holdings which is intended to provide the long-term consistent returns investors are after with a core equity holding.

Disclaimer
This is not substantive investment research or a research recommendation, as it does not constitute substantive research or analysis. This material should be considered as general market commentary.
Alternative investments Commentary » Commentary » Investment trusts Commentary » Investment trusts Latest » Latest » Mutual funds Commentary
Leave a Reply
You must be logged in to post a comment.