Apr
2023
Investment trusts: Shopping for discounts
DIY Investor
25 April 2023
![]()

Could wide investment trust discounts represent an opportunity?
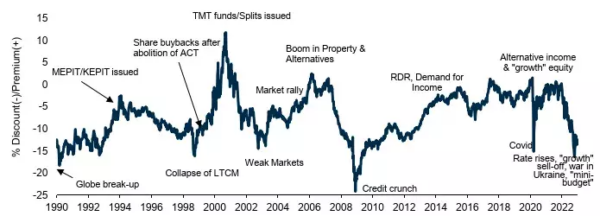
UK investment trusts are trading at the widest discount seen since the financial crisis, according to recent research from Numis. The share price of the average investment trust was trading 13% below its net asset value in 2022, with the discount widening considerably in the aftermath of Russia’s invasion of Ukraine and as rising interest rates and a worsening economic environment impacted investor sentiment.
This suggests that there is value to be found in this well-established and diverse part of the UK investment industry. The chart below shows that discounts do tend to widen during times of economic and market uncertainty, but ultimately, such a steep level of discount does not last long.
This could, therefore, be a good time for investors to be considering investment trusts as a buying opportunity.
Discounts explained
Investment trusts are stock market listed companies, so their shares are subject to the forces of demand and supply. A stock market works by setting a price at which demand (the quantity of shares that investors want to buy) and supply (the quantity of shares that investors want to sell) are in equilibrium. As demand and supply change over time, you should expect a share price to move to maintain the balance between these two forces.
‘there is value to be found in this well-established and diverse part of
the UK investment industry’
This is the same for all quoted companies, but with investment trusts there is an additional measure of actual value, against which the share price can be compared. This is known as ‘net asset value’ (NAV for short), and it is essentially the value of all the assets held in that investment trust’s portfolio at a given point in time expressed on a per share basis.
Most investment trusts release their NAV every working day, but some – particularly those that invest in less liquid or private assets – may release their NAVs less frequently.
The presence of a NAV calculation means that investors get a regular look at the actual value of that investment trust which they can then compare to the prevailing share price to get a sense of how cheap or expensive it is.
This is a key differentiator between investment trusts and other ‘open-ended’ investment vehicles such as OEICs, ICVCs and unit trusts, where the value at which investors can buy or sell units is determined explicitly by the net asset value, and supply and demand are instead balanced by changing the number of units in issue on a daily basis.
‘This could, therefore, be a good time for investors to be considering investment trusts as a buying opportunity’
When the share price of an investment trust is trading below its NAV, it is said to be trading at a discount. Conversely, if the investment trust’s share price is above its NAV, it is said to be trading at a premium.
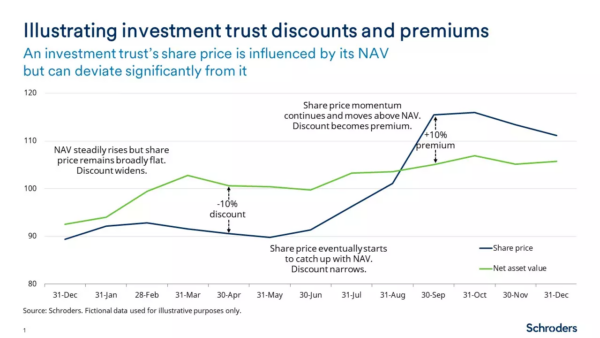
The chart and table below should help to illustrate this with a simple example, showing how the share price and NAV of an investment trust interact over time. Put simply, an investment trust’s share price will be influenced by its NAV but over time, for a variety of reasons, it can deviate significantly from it in both directions.
Any reference to sectors/countries/stocks/securities are for illustrative purposes only and not a recommendation to buy or sell any financial instrument/securities or adopt any investment strategy.
Using the example above, investors would have the opportunity to buy a portfolio estimated to be worth 100.6p per share for 90.5p per share. At a 10% discount, you get 1p in every 10p for free.
Why do investment trust share prices move away from NAV?
As the chart at the top of the article demonstrates, investment trusts tend to trade at a modest discount to NAV, but it is not unusual for trusts to trade at a premium in certain circumstances.
‘try to understand why an investment trust share price has deviated from its NAV before making an investment decision’
Broadly speaking, if an investment trust is trading on a discount, it reflects slightly lower demand for its shares than there is supply – in other words, there are more marginal sellers than buyers. This can happen for a number of reasons, such as uncertainty about the outlook for the asset class the trust is invested in, or a lack of interest or liquidity in a particular market or investment theme.
By contrast, an investment trust on a premium tends to reflect high demand as a result of elevated investor enthusiasm for a particular characteristic. Sometimes, however, discounts and premiums can arise simply because stock markets are not always totally efficient.
For investment trusts that release NAV data less frequently, a discount or premium may represent the market trying to estimate the change in the value of its assets since the NAV was last released.
‘The potential opportunity to buy an asset for less than it is estimated to be worth’
So, it is always important to try to understand why an investment trust share price has deviated from its NAV before making an investment decision. Nevertheless, a discount does effectively mean that investors have the potential opportunity to buy an asset for less than it is estimated to be worth. It’s bargain hunting time!
Occasionally, however, investment trusts can fall to very steep discounts. 50% discounts or more are not unheard of, and this essentially means investors may be in “buy one, get one free” territory.
Which Schroders investment trusts are currently available to buy at a discount?
As the chart below illustrates, all Schroders investment trusts are currently available to buy at a share price below net asset value. Discounts range from -2.3% on the Schroders Income Growth Fund, through to -49.2% for Schroders UK Public Private Trust plc.
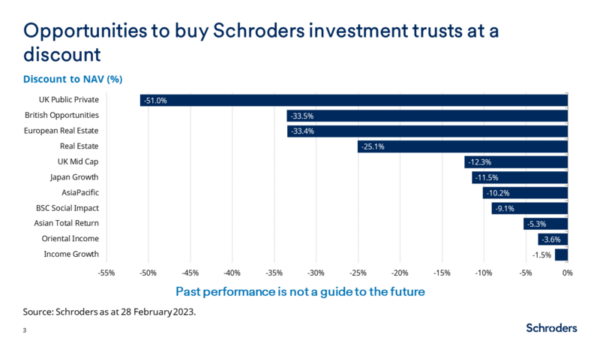
At the moment, discounts appear particularly steep for investment trusts that are investing in relatively illiquid assets such as private companies and real estate, where NAV data is available less frequently.
This perhaps reflects uncertainty about what may happen to the value of those assets during the current challenging economic environment, but it should be remembered that investment trusts are highly suitable vehicles for illiquid assets, because they represent a permanent source of capital.
‘can create very attractive buying opportunities for the long-term investor’
This means the managers of the trusts have time to trade in and out of less liquid assets without becoming forced sellers, which has been known to cause serious problems for open-ended funds in the recent past.
Meanwhile, investors should view less liquid asset classes with a particularly long-term investment horizon, over which time the ultimate opportunity for growth should comfortably offset any near-term uncertainty. Indeed, history suggests that financial markets have a habit of discounting too much bad news in the near-term, which can create very attractive buying opportunities for the long-term investor.
Conclusion
The fact that UK investment trusts have been trading at their widest discount for fifteen years suggests there are currently bargains to be found if investors look carefully. Due diligence is, as always, vital, and investors should do their research before committing to an investment.
We are confident in the investment proposition of each of Schroders investment trusts and would encourage investors to find out more in order to understand the individual attractions of the Schroders range.
The long-term chart at the beginning of this article suggests that the broad level of discount currently seen on UK investment trusts won’t remain this wide forever. Happy shopping!
Click here to find out more about Schroders Investment Trusts >
Never miss an update – subscribe to our monthly newsletter >
![]()
Schroder Real Estate – The outlook for UK property – Nick Montgomery
This is a marketing communication.
Past performance is not a guide to future performance and may not be repeated. The value of investments and the income from them may go down as well as up and investors may not get back the amounts originally invested. The material is not intended to provide, and should not be relied on for, accounting, legal or tax advice, or investment recommendations. Reliance should not be placed on any views or information in the material when taking individual investment and/or strategic decisions. Any reference to sectors/countries/stocks/securities are for illustrative purposes only and not a recommendation to buy or sell any financial
instrument/securities or adopt any investment strategy.
Information herein is believed to be reliable but Schroders does not warrant its completeness or accuracy.
For help in understanding any terms used, please visit address https://www.schroders.com/en/insights/invest-iq/investiq/education-hub/glossary/
We recommend you seek financial advice from an Independent Adviser before making an investment decision. If you don’t already have an Adviser, you can find one at www.unbiased.co.uk or www.vouchedfor.co.uk.
Before investing in an Investment Trust, refer to the prospectus, the latest Key Information Document (KID) and Key Features Document (KFD) at www.schroders.co.uk/investor or on request.
Issued in March 2023 by Schroder Unit Trusts Limited, 1 London Wall Place, London EC2Y 5AU. Registration No 4191730 England. Authorised and regulated by the Financial Conduct Authority.
Important information
This communication is marketing material. The views and opinions contained herein are those of the named author(s) on this page, and may not necessarily represent views expressed or reflected in other Schroders communications, strategies or funds.
This document is intended to be for information purposes only and it is not intended as promotional material in any respect. The material is not intended as an offer or solicitation for the purchase or sale of any financial instrument.
The material is not intended to provide, and should not be relied on for, accounting, legal or tax advice, or investment recommendations. Information herein is believed to be reliable but Schroder Investment Management Ltd (Schroders) does not warrant its completeness or accuracy.
The data has been sourced by Schroders and should be independently verified before further publication or use. No responsibility can be accepted for error of fact or opinion. This does not exclude or restrict any duty or liability that Schroders has to its customers under the Financial Services and Markets Act 2000 (as amended from time to time) or any other regulatory system.
Reliance should not be placed on the views and information in the document when taking individual investment and/or strategic decisions.
Past Performance is not a guide to future performance. The value of investments and the income from them may go down as well as up and investors may not get back the amounts originally invested. Exchange rate changes may cause the value of any overseas investments to rise or fall. Any sectors, securities, regions or countries shown above are for illustrative purposes only and are not to be considered a recommendation to buy or sell.
The forecasts included should not be relied upon, are not guaranteed and are provided only as at the date of issue. Our forecasts are based on our own assumptions which may change. Forecasts and assumptions may be affected by external economic or
other factors. Issued by Schroder Unit Trusts Limited, 1 London Wall Place, London EC2Y 5AU. Registered Number 4191730 England. Authorised and regulated by the Financial Conduct Authority
Brokers Commentary » Brokers Latest » Commentary » Investment trusts Commentary » Investment trusts Latest » Latest » Mutual funds Commentary » Take control of your finances commentary » Uncategorized
Leave a Reply
You must be logged in to post a comment.