Apr
2023
Are we nearly there yet?
DIY Investor
25 April 2023
We look at which trusts have done best year to date and ask where there might be value…by Thomas McMahon
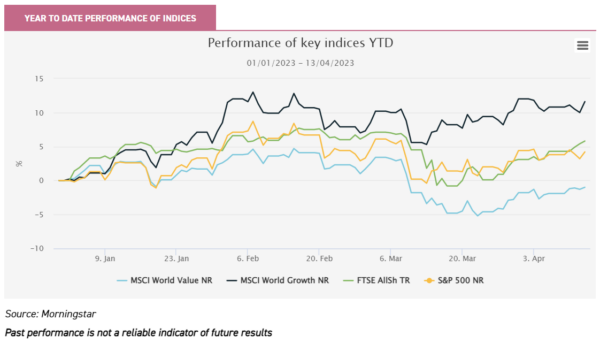
The year so far has seen a modest recovery in equity markets, with the FTSE All-Share Index up 5.8% and the S&P 500 Index up 4.2%, at the time of writing. This has been driven by a rebound in growth, which has outperformed value, using the respective MSCI World indices, by 14%.
The US ten-year yield, a major influence on the price of other financial assets, has not actually moved much, falling slightly from 3.7% at the start of January to 3.4% at the start of April. It did rise above 4% in March as inflationary fears rose, before falling as new data suggested inflation had peaked and a banking crisis made interest rate cuts seem more likely.
To us, it is suggestive that growth equities outperformed, even in the earlier part of the period as yields rose. In our view, this may indicate that growth was being bought purely on valuation grounds, even before data suggested lower rates might be nearer, i.e. that this move in growth is not just a macro play.
However, this is not the whole story. Looking at the performance of investment trusts and their discounts, we think some interesting features emerge which may suggest where there is value.
Performance
Technology and growth-focussed trusts have been leading the pack year to date. Polar Capital Technology (PCT) and Allianz Technology Trust (ATT) are up 14.5% and 11%, respectively.
Meanwhile, Martin Currie Global Portfolio (MNP) and BlackRock Greater Europe (BRGE) are among the growth-focussed all-sector portfolios to have returned double-digits in NAV total return terms. European trusts, in particular, have done well, despite the wobble seen in the region’s markets when Credit Suisse collapsed.
Henderson EuroTrust (HNE) and Fidelity European Trust (FEV) have also returned over 10%. Henderson European Focus (HEFT) and the European Opportunities Trust (EOT) have each returned over 9%.
Top ten trusts by NAV TR in 2023 year to date
| NAME | CUM FAIR NAV RETURN (CUMULATIVE) |
| Polar Capital Technology | 14.5 |
| Aurora | 14.4 |
| Marble Point Loan Financing | 14.2 |
| Martin Currie Global Portfolio | 14.0 |
| BlackRock Greater Europe | 13.3 |
| Henderson EuroTrust | 11.6 |
| Downing Strategic MicroCap | 11.4 |
| Allianz Technology | 11.0 |
| Fidelity European Trust | 10.4 |
| Canadian General Investments | 10.0 |
Source: Morningstar, to 12/04/2023
Past performance is not a reliable indicator of future results
However, there is certainly not a general picture of growth outperforming which would imply a market rotation taking place based on lower interest rate expectations and a return to pre-pandemic normal.
Strong performance has been concentrated in developed world, large-cap growth stocks, largely in the US and Europe. The two UK-focussed portfolios to have done the best, i.e. Aurora (ARR) and Downing Strategic Micro-Cap (DSM), have more value-focussed strategies, as does Canadian General Investments (CGI), if only by virtue of the structure of the Canadian market.
Looking on a share price total-return basis, perhaps unsurprisingly over such a short period, corporate action and change has been behind some of the largest movers, such as Ediston Property Investment Company (EPIC) which announced a strategic review.
Majedie Investments (MAJE) is another example, as the trust produced share price returns just outside the top ten, of 12.8%. MAJE has appointed a new manager, Marylebone Partners, with a new strategy aimed at offering investors a liquid endowment-like portfolio unlike anything in the investment trust universe. Initial reaction has been positive, with the discount closing from c. 23% in January to 13.6%, at the time of writing. We analysed the new strategy in a recent note.
Top ten trusts by share price TR in 2023 year to date
| NAME | MARKET RETURN (CUMULATIVE) |
| JPMorgan Emerging E, Me & Africaa Sec plc | 22.8 |
| DP Aircraft I | 22.2 |
| Investment Company | 20.3 |
| Amedeo Air Four Plus | 19.9 |
| Nippon Active Value | 18.3 |
| Macau Property Opportunities | 18.2 |
| Ediston Property Investment Company | 18.1 |
| Pollen Street | 16.6 |
| Martin Currie Global Portfolio | 16.0 |
| CT Private Equity Trust | 14.0 |
Source: Morningstar, to 12/04/2023
Past performance is not a reliable indicator of future results
There are also some examples of trusts and sectors that have been most out of favour rebounding, such as the aircraft leasing funds, and a similar move may be behind the uptick in the NAV of the two UK small-cap trusts referred to earlier, at the underlying holding level.
Notably, however, this renewed appetite hasn’t really extended to many trusts in the illiquid asset classes, at least not at the top of the performance list. CT Private Equity Trust (CTPE) is one exception but, despite strong share price gains, it is still trading at a discount of 33.7%. Tritax Big Box (BBOX) has seen decent gains of 8.2%, despite not posting a new NAV, perhaps mirroring the bounce in tech and growth assets. Schroder Real Estate (SREI) has also seen strong share price gains of 10.4%, perhaps reflecting the market’s recognition of the strength of its balance sheet.
Discounts
To us, it looks like holdings in private assets are one of the key themes determining which trusts are at wide discounts versus history. In our view, this explains why Scottish Mortgage (SMT)’s discount is over 3.5 standard deviations below its five-year average. Despite holding many large-cap growth stocks and having exposure to technology in various forms, SMT’s discount is still extremely wide.
There are other issues at SMT: Moderna, the largest holding, has been under pressure, and there has been a boardroom bust-up which has garnered bad press. At the heart of the disagreements amongst board members seems to be the unlisted portfolio, though. In our view, if confidence can be built in the valuations of the unlisted holdings in SMT, then there must be scope for the remarkable discount to narrow.
Lowest five-year Z-Sores
| NAME | LATEST DISCOUNT (CUM FAIR) |
5 YEAR AVERAGE | Z-SCORE |
| Capital Gearing | -2.1 | 3.0 | -6.5 |
| Residential Secure Income | -38.0 | -9.9 | -4.1 |
| Scottish Mortgage | -19.6 | -1.5 | -3.7 |
| Triple Point Social Housing REIT | -62.0 | -10.5 | -3.3 |
| Premier Miton Global Renewables | -21.5 | -7.3 | -3.0 |
| SDCL Energy Efficiency Income | -16.3 | 7.3 | -3.0 |
| Personal Assets | -0.9 | 1.2 | -3.0 |
| Invesco Select UK Equity | -16.9 | -4.1 | -2.9 |
| LXI REIT | -28.7 | 1.7 | -2.9 |
| Greencoat UK Wind | -3.5 | 14.6 | -2.9 |
| Invesco Select Global Equity Income | -13.4 | -3.6 | -2.9 |
| Greencoat Renewables | -0.9 | 13.4 | -2.7 |
| Gore Street Energy Storage Fund | -10.5 | 5.6 | -2.7 |
| GCP Asset Backed Income | -24.3 | -2.0 | -2.7 |
| GCP Infrastructure Investment | -20.5 | 5.4 | -2.6 |
| Sequoia Economic Infrastructure Income | -12.0 | 5.0 | -2.6 |
| Monks | -11.3 | 0.3 | -2.6 |
| Harmony Energy Income Trust | -10.1 | 0.2 | -2.6 |
| ICG-Longbow Senior Sec. UK Prop Debt Inv | -32.7 | -7.8 | -2.5 |
Source: Morningstar, to 12/04/2023
Many of the other lowest z-scores are amongst renewables and infrastructure trusts, as well as amongst property sectors seen as bond proxies when yields were lower on government debt.
This may be driven by valuations and concerns about discount rates. In that light, we find it interesting that technology and large-cap growth stocks have outperformed. This seems to us to indicate a belief that peak inflation has passed, and the pressure on equity valuations should be relieved in anticipation of rate cuts.
But surely then, infrastructure and other illiquid, high-yielding assets should also see a re-rating? Could it be that the equity market has moved first and the share prices of infrastructure, property and unlisted investments, such as the listed private equity sector or SMT, have lagged?
This could make sense, as activity in the underlying markets for unlisted companies is likely to pick up more slowly – it is simpler to hit ‘buy’ on a screen and load up on listed stocks, than complete a private transaction.
As such, buyers of investment trusts may be holding fire. After all, there have been other false dawns when it comes to peak inflation. If this one proves to be the real thing, we think there may be value in some of these illiquid assets.
Interestingly, the other obvious theme amongst trusts with the lowest Z-scores is defensives. Capital Gearing and Personal Assets are both at wide discounts versus their five-year averages. Both have discount control mechanisms, so their ratings have been pinned fairly close to par and the discounts are not wide in absolute terms.
However, both have been on discounts for over a month, despite buying back shares. Given their tendency to trade on premiums, this could be an advantageous time to gain exposure for those who want to hold these for the long term.
Performance of Kepler team’s picks
Finally, we turn our attention to the picks of your analyst team. Like a skull kept on a desk in the renaissance as a memento mori, our annual picks keep us humble. Our rationale for our selections was published in January.
Leading the pack (in NAV and share price terms) is European Opportunities Trust (EOT). Alexander Darwall’s portfolio is made up of quality growth large-caps, and as such has benefitted from growth being in favour and also perhaps the defensive qualities in the portfolio which should mean it is relatively protected from any recession.
AVI Japan Opportunity (AJOT) has also performed well. AJOT is the top-performing Japanese small-cap trust since it was launched, and second only to one Japan equity trust over the period. Its strategy sees returns generated from idiosyncratic activist opportunities, which means it is less dependent on the health of the overall market for returns.
Nonetheless, Japan has started 2023 in a better place, which may aid absolute returns, as we discuss in our recent note.
Hipgnosis Songs (SONG) has also seen a bounce in share price terms, although the NAV has not moved much. This may reflect the dynamic we have identified above: there has been a shift from value to growth in equities, as interest rate expectations have changed, but growth-sensitive alternatives have not repriced.
Arguably, this could be an opportunity, particularly in SONG given the wide discount, but investors may be waiting to get confirmation of the NAV via sales of assets.
Year to date performance of picks
| LATEST DISCOUNT (CUM FAIR) |
CUM FAIR NAV RETURN (CUMULATIVE) |
MARKET RETURN (CUMULATIVE) |
ANALYST | |
| European Opportunities Trust | -14.6 | 9.3 | 7.3 | Alan Ray |
| AVI Japan Opportunities | -2.2 | 5.7 | 5.1 | Thomas McMahon |
| Global Smaller Companies | -12.3 | 1.7 | 1.3 | Ryan Lightfoot-Aminoff |
| Hipgnosis Songs | -46.0 | 0.9 | 3.7 | William Heathcoat Amory |
| AVI Global | -9.3 | -0.1 | -0.4 | Nicholas Todd |
| Bellevue Healthcare | -4.7 | -2.0 | 2.6 | Pascal Dowling |
Source: Morningstar, to 12/04/2023
Past performance is not a reliable indicator of future results
Conclusion
Surveying the market, it looks to us as if it is tentatively beginning to price in a peak in inflation and lower interest rates to come. However, the riskier equities – i.e. small caps – and illiquid assets have not moved much yet.
We think this is likely because consensus has not yet formed on whether rates will be cut in the teeth of a recession or whether the developed world economies have scraped through this inflationary spurt without triggering any serious decline in economic activity. Employment data is extremely resilient, and PMIs also looking OK.
While UK manufacturing PMIs indicate strong expected growth, the US is teetering around 50, implying no growth, beating expectations for a decline. The Eurozone picture is more negative, perhaps because the fallout from the Ukraine war has a greater impact on energy supply and manufacturing.
To us, many alternative asset trusts, from property to more unconventional assets, look extremely interesting on their current discounts. When it comes to small-caps, we have no greater insight to offer than the world’s economists, but taking exposure at these discounts and after a sell-off could lead to excellent returns if the optimistic scenario pans out.

Disclaimer
This is not substantive investment research or a research recommendation, as it does not constitute substantive research or analysis. This material should be considered as general market commentary.
Brokers Commentary » Brokers Latest » Commentary » Investment trusts Commentary » Investment trusts Latest » Latest » Mutual funds Commentary
Leave a Reply
You must be logged in to post a comment.