Feb
2023
Go your own way
DIY Investor
2 February 2023
Our analysis shows that investment trusts offer better diversification for those seeking income from equities…by Helal Miah
Are UK Equity Income Trusts closet trackers?
Income concentration in the UK market is a real problem. In fact, we would argue that one of the key benefits of going active for income is the ability a manager has to diversify the sources of dividends and, thereby, the risks to an income stream.
Our analysis shows that the dividends in the investment trust sector are much more diversified than they are in the UK market and there are a number of trusts with highly-differentiated approaches, which means they can offer good diversification to the more traditional income funds.
We gathered dividend information on all the FTSE All-Share Index companies, excluding investment trusts, from Bloomberg. We looked at the absolute level of dividend paid, i.e. the sterling amount paid out by each company, over 2022. This also includes dividends related to 2021, but it gives us a rolling twelve-month figure.
The headline number from this data gathering is that UK plc paid out £95.6bn in dividends during 2022, based on average foreign currency rates over the year. The weaker sterling rate, especially against the US dollar, has had a significant impact on lifting the overall figure as a number of the large listed companies pay their dividends in dollars. Analysis by Link Group suggests that sterling’s weakness has added around £5.7bn to the overall figure.
Unsurprisingly, commodity producers have made a major contribution. Both energy and mining companies have benefitted hugely from supply constraints and higher prices and have rewarded investors with great ordinary dividends and bumper special dividends from the miners.
However, while the overall payout for 2022 is approximately 5.5% higher than in 2021, this is still lower than the pandemic peak of £110.9bn, as other sectors are still in the recovery process.
In the table below, we list the ten largest dividend-payers, including specials, amongst UK-listed companies during 2022. Extraordinarily, Rio Tinto accounted for 14%, as a result of an exceptionally strong few years of profitability and their announcement of a total dividend payout of $16.8bn for the 2021 financial year, paid during 2022.
This was the second highest on record and behind Vodafone’s £18bn in 2014, after the sale of assets. As the table shows, the top ten dividend-payers accounted for 53.7% of the total, certainly a high level of concentration.
This compares to their 40.4% market cap weight, excluding investment trusts. Even removing Rio Tinto, the next top ten dividend-payers accounted for 41.9% of the total. These had an unweighted average dividend yield of 4.8%, compared to the overall FTSE All-Share Index figure of approximately 3.6%, so not only are they large dividend-payers in absolute terms, but unsurprisingly relatively high-yielding shares too.
Table A: UK Plc top dividend-payers
| STOCK | SECTOR | % OF TOTAL FTSE ALL-SHARE DIVIDENDS PAID |
| Rio Tinto | Basic Materials | 14.0 |
| Shell | Energy | 6.3 |
| HSBC Holdings | Financial | 5.4 |
| British American Tobacco | Consumer, Non-cyclical | 5.2 |
| Unilever | Consumer, Non-cyclical | 4.6 |
| Anglo American | Basic Materials | 4.4 |
| GSK | Consumer, Non-cyclical | 3.9 |
| AstraZeneca | Consumer, Non-cyclical | 3.7 |
| BP | Energy | 3.7 |
| Glencore | Basic Materials | 2.6 |
| Total | 53.7 |
Source: Bloomberg,as at 31/12/2022
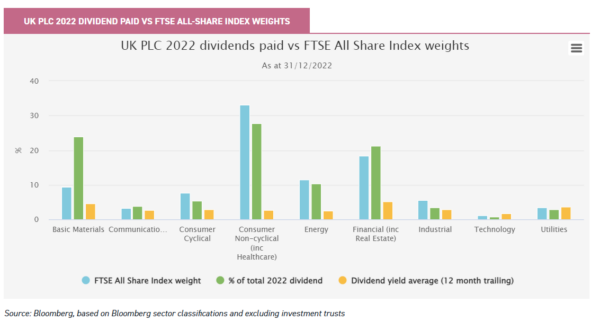
In the bar chart below, we demonstrate how last year’s dividends have been distributed across sectors and compared against their weights in the FTSE All-Share Index. The impact of Rio Tinto’s record dividend is apparent for the basic resources’ sector, as the sector generated 24% of last year’s total dividend. While Rio Tinto’s dividend is unusually large, the good times in the sector are also reflected across other names, such as Anglo American. Both of these companies paid dividends, as a proportion of the total, that were way in excess of the size suggested by their market cap weightings in the FTSE All-Share Index. Clearly, materials and financials are critical to the dividends paid by the UK market as a whole and, while they have done relatively well over the past year, they are both cyclical sectors with considerable risk.
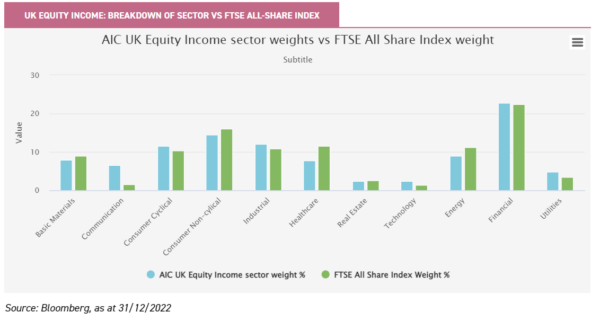
We can’t measure exactly where the yield comes from in the UK equity income sector, but we can look at the portfolio weights, which gives us a rough idea. The chart below shows that the sector weights are roughly equivalent, on average, in the UK equity income sector. So, does this mean low diversification?
Not if we look at the stock level. We find that the trusts may have similar sector weights on average, but they are active in terms of which stocks they pick. We collated the latest and readily-available top ten holdings of each trust, sourced from Morningstar. Of the 21 investment trusts in the sector, oil giant Shell featured amongst the top ten holdings of twelve trusts, with an average weighting of 6.3%. Interestingly, this is lower than Shell’s weighting of 7.2% in the FTSE All-Share Index.
Therefore, collectively, the UK equity income managers are underweight Shell today. We are only looking at the top ten holdings and were we to consider all holdings in a portfolio, then the maths would suggest that the average weighting in Shell across the 21 trusts in the sector is even lower than 6.3%. In this regard, the UK equity income sector is collectively active with an underweight position in Shell.
While there is no definitive answer as to why they are underweight, we speculate that the strong rally in the share price since the outbreak of the war in Ukraine could have led some managers to top slice positions and the lower dividend yield by Shell’s historic standards not looking as attractive.
Table B: AIC UK Equity Income Sector – Most commonly held stocks in top ten lists
| STOCK | NO. OF TRUSTS FEATURED IN TOP TEN | AVERAGE PORTFOLIO WEIGHT % | FTSE ALL-SHARE INDEX WEIGHT % | DIVIDEND YIELD % | % OF TOTAL 2022 FTSE ALL-SHARE INDEX DIVIDENDS PAID |
| Shell | 12 | 6.3 | 7.2 | 3.4 | 6.3 |
| AstraZeneca | 11 | 6.3 | 7.2 | 2.0 | 3.7 |
| RELX | 11 | 5.4 | 1.9 | 2.2 | 1.0 |
| Unilever | 10 | 5.5 | 4.6 | 3.5 | 4.6 |
| BP | 10 | 4.7 | 3.7 | 3.9 | 3.7 |
| GSK | 9 | 3.8 | 2.5 | 5.4 | 3.9 |
| Diageo | 7 | 6.4 | 3.6 | 2.1 | 1.8 |
| British American Tobacco | 7 | 5.2 | 3.2 | 7.0 | 5.2 |
| Rio Tinto | 7 | 4.3 | 2.7 | 9.2 | 14.0 |
| Anglo American | 6 | 3.7 | 1.7 | 6.5 | 4.4 |
| Total | 90 | 51.4 | 38.3 | 48.6 |
Source: Bloomberg, Morningstar, as at 31/12/2022
One feature that may surprise some readers is that in the above table, there are no financial stocks. Sure, they feature in the top ten and further down for individual trusts, but it seems that no one financial company is that heavily relied upon to generate income across these 21 trusts. One possible reason why could be that the largest listed financial company in the UK is HSBC and some investors have become increasingly wary about the political risks associated with the bank’s Chinese operations.
Another reason could be that the next largest financial, by market cap, is Barclays. Its FTSE All-Share Index weight is just 1.4%, placing it as the 14th-largest company, and it doesn’t seem as though many managers are willing to take a highly-active position on it. However, we know that many of the trusts in the UK equity income space do allocate a large portion of their portfolio to the financials and, often, it is their largest sector weight.
The UK is a major global financial hub with a large number of different types of financial companies, therefore, investment managers have a wide choice of financial companies to include in their portfolio to meet their investment goals. In turn, they do not need to rely on just a few. This is, to a certain extent, the opposite of what we have in the UK energy sector, where there are only really two options of significance, Shell and BP, which is partly why they feature in so many portfolios.
This point is further illustrated in the table below. Of the 21 trusts, financials companies featured in the top ten holdings’ lists on 50 occasions, while energy companies appeared 32 times. However, consumer non-cyclicals feature most commonly, at 71 times.
Table C: Sector appearances in top ten holdings lists
| SECTOR | APPEARANCES IN TOP TEN HOLDINGS LISTS |
| Consumer Non-Cyclical (inc Healthcare) | 71 |
| Financial (inc Real Estate) | 50 |
| Energy | 32 |
| Basic Materials | 23 |
| Consumer Cyclical | 13 |
| Utilities | 11 |
| Communications | 6 |
| Industrial | 3 |
| Technology | 1 |
Source: Bloomberg, Morningstar, as at 31/12/2022
We have shown that the AIC UK Equity Income sector offers a less concentrated portfolio, on average. While it has a similar sector positioning to the index, this hides significant divergence at the stock level. The ability of trusts to invest in overseas’ markets provides additional diversification potential and we find that the average overseas’ position in the sector is around 15%.
Whatever is true of the average, the UK equity income sector contains a number of trusts which are particularly differentiated and, therefore, offer even more diversification benefits. This includes trusts which are focussed on mid and small caps, as well as some which use innovative structures to invest in more growth-focussed stocks, while still generating yield.
We would highlight Diverse Income Trust (DIVI), with no stocks in its top ten list in common with that in Table B, making it one of the most diverse compared to its peers. It kind of does what it says on the tin. The fund managers, Gervais Williams and Martin Turner, are small cap-specialists. They have allocated only around 20% to FTSE 100 Index stocks, with the bulk of the remainder in FTSE 250 Index stocks and below.
They use a bottom-up selection approach, favouring companies with a clear path to substantial cash generation, where the duration of those cash flows are weighted to the near-term. As discussed earlier, there is a large number and variety of financial stocks offering attractive dividends and this has enabled the team to allocate around a third of the portfolio to this sector, with a well-diversified spread in the remaining sectors.
The team have a thesis that globalisation is on a reversing trend and that this will play out better for smaller UK companies than the giant multinationals.
We also highlight abrdn Equity Income (AEI) as another trust with a differentiated top ten compared to its peers, by having only two stocks common to those in Table B, i.e. Shell and BP. This would be partly explained by the manager, Thomas Moore, using a benchmark-agnostic and contrarian style of investing, eschewing in vogue stocks trading at higher multiples to their underlying fundamentals. Instead, he seeks out-of-favour companies trading cheaply relative to their fundamentals, i.e. a bias towards value investments.
The mandate is to generate above-average income, while also providing growth in capital and income. Thomas believes that a focus on income can go hand in hand with capital growth, through looking for stocks with the potential to surprise positively on cash flows and dividends, which in turn raises the share price upon recognition by the wider market. He believes there are more mispriced stocks lower down the market cap spectrum.
Therefore, by allocating approximately half to stocks outside of the FTSE 100 Index, this gives the portfolio a differentiated positioning versus its peers. With a dividend yield of around 6.5%, a large premium to the FTSE All-Share Index’s 3.6%, AEI provides one of the highest yields amongst its peers and 22 years of consecutive dividend increases places it amongst the AIC’s ‘Dividend Heroes’.
However, over the medium term, the popularity of growth stocks at the expense of value has led to underperformance, but the highly uncertain market conditions over the past year have brought value stocks back into favour. Should this carry on, we think Thomas’s style could be vindicated.
Shires Income (SHRS), which is managed by Iain Pyle and Charles Luke, shares only three stocks in common with Table B, namely AstraZeneca, BP and Shell. What sets SHRS apart from its peer group is its use of gearing to invest in high-yielding preferences.
The gearing does not necessarily mean that the portfolio takes on extra risk, since preference shares tend to exhibit less volatility than ordinary shares, although bond-like duration risk is introduced. The use of high-yielding preference shares allows the managers to dip into smaller and mid-sized companies to add an element of growth to the portfolio for balance.
The range of income and growth options amongst the financials make this sector the largest, with an exposure at just under 40% of the portfolio, and is followed by energy, at approximately 14%. Meanwhile, the largest sector in the FTSE All-Share Index, Consumer Staples (non-cyclical), is only at 9.5%, as at 31/12/2022. This highlights SHRS’s differentiated positioning.
Dunedin Income Growth (DIG) is also worth a mention, given its explicit ESG mandate, as this gives rise to a differentiated portfolio. Although its top ten holdings have four stocks in common with Table B, notably absent here are the big oil, mining and tobacco stocks. Manager Ben Ritchie also tends to use his 20% potential allocation to European stocks to the full, further emphasising the diversification potential in the portfolio.

Disclaimer
This is not substantive investment research or a research recommendation, as it does not constitute substantive research or analysis. This material should be considered as general market commentary.
Brokers Commentary » Commentary » Investment trusts Commentary » Investment trusts Latest » Latest » Mutual funds Commentary
Leave a Reply
You must be logged in to post a comment.