Dec
2022
Bottom fishing
DIY Investor
7 December 2022
What can history tell investors about calling the bottom of a market?…By Thomas McMahon
Most investors have been selling over the past year. This is evident in the widening of discounts across the investment trust sector and the significant outflows seen from open-ended funds. There have been net outflows from investment association funds in each month but one since January. The economic reasons are well known and have led to sell-offs in major stock and bond indices, as well as rate-sensitive alternative assets. The key question for investors now is: when will the bottom be reached? Maybe we have seen it already? Here, we consider some potential signs that the nadir may be near and discuss how investors should best approach buying back in.
Is it still too early?
In ‘Anatomy of the Bear’, Russell Napier outlines a number of signals of a bottom in markets. One of the most interesting, given current market dynamics, is the link between a bond market rally and a recovery in equity markets. Currently, we are seeing equity markets rally, essentially at the same time as bond markets. The market is seeing signs of a reversal of Fed policy as being bullish for bonds, as rate cuts are closer, and bullish for equities, as easy money should therefore lead to inflows into equities. Therefore, whenever peak inflation seems near or the economy appears to be weakening, it is being read as a buy signal for both asset classes. However, historically, the major market bottoms have seen equities continue to fall after bond markets bottomed. In 1921, the lag was 14 months; 1932, seven; 1949, nine; and in 1982, it was 11 (the average being therefore ten months). We would note that the simultaneous jumps in bonds and equities which we are experiencing continue the pre-pandemic, pre-inflation trend, in which buying long-duration assets whenever they dipped was the way to outperform.
So why might a bottom in bonds not be an immediate buy signal for equities? Well, this strategy worked when nominal growth and inflation were low and the task for the world’s central banks was to prevent the global economy from slipping into deflation. Implicitly, the positive correlation between bonds and equities is a bet on a return to this world, in which rate cuts will be necessary to inject nominal growth back into the economy and companies will enjoy smooth growth paths for earnings. If inflation is now embedded in the world economy, then although rate cuts will not necessarily follow a halt in rate hikes, they may at least be more modest than expected. Additionally, embedded inflation would imply all sorts of economic problems which could see earnings disappoint for some time, offsetting any boost from rate cuts.
Reasons to expect inflation to remain persistently high and volatile include de-globalisation, the authoritarian turn in China, the removal of Russia from Western energy markets and a focus on energy security and the drive to net zero, which will keep the prices of energy and raw materials high. We would add that there is a strong political dimension too: demands for inflation-busting pay rises are only likely to increase (Andrew Bailey’s strategy of asking people to take a pay cut so he doesn’t have to hike rates is unlikely to work) while austerity is likely to be as popular. as a bucket of cold sick. Don’t take our word for it, listen to hedge fund legend Stanley Druckenmiller: “Do you think the UK unions, when they come to negotiate in the spring, are going to say ‘oh well the 5y/5y forward is just 2%’? No, of course not”. In this environment, it could be that rate cuts would be viewed as a mistake with the same alacrity as the ECB’s rate hike in 2011. Inflation is now the number one political concern of authorities in the UK, USA and Europe; not unemployment, as was the case during the last cycle.
In fact, the employment figures in the UK, USA and EU remain strong, while nominal growth is nearly above water. This makes inflation more intractable and if economic activity would just reduce faster, rate hikes might be avoided. Back in February, we argued that inflation was likely to remain higher than generally expected. One of the reasons we gave was the ability of the consumer to spend and chase prices higher very high, with low levels of household debt and low interest service costs thanks to a decade and a half of rock-bottom rates. There is a lag to these data points, so there is not much of an update since that note. The latest figures for debt service payments as a percentage of GDP for the US is only as of June, but it had barely moved from the start of the year: 9.6% compared to 9.3%. It was over 13% in 2008.
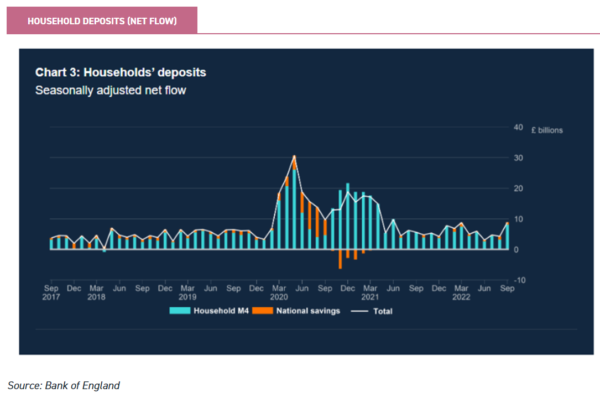
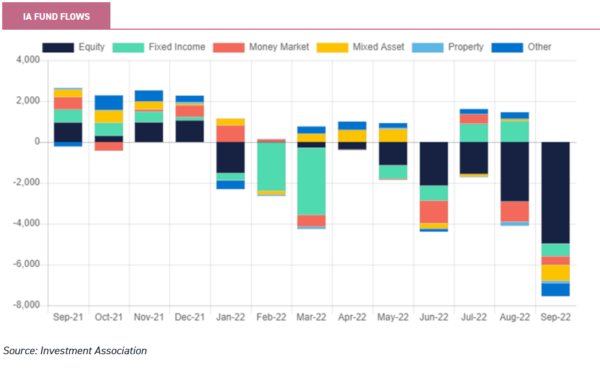
We think the UK data for September, shown below, is highly suggestive. According to the Bank of England, £8.9bn was deposited with banks and building societies in September, the highest since furlough and lockdowns and well above the pre-pandemic norms. How can this be if the consumer is under pressure? Well, the next chart suggests the reason. It shows outflows from investment association funds, which can be used to represent retail fund flows, of c. £8bn. That is £8bn of savings shifted into bank accounts to buy goods and services, leading to selling pressure on equities and buying pressure on retail prices. It helps explain why retail sales by value fell only 2% in September year-on-year, while prices had risen by 10%. Last year, a key question for investors to answer was: how long could a temporary period of inflation last? Perhaps this year the key question is how long can a recession loom?
Russell’s historical analysis suggests rate cuts are a sign a bottom in markets is getting nearer. This didn’t work in 1929, but in the three other major bear markets, rate cuts came an average of six months before equity markets bottomed. If bond prices were to peak in anticipation of rate cuts, then this could make sense if there was a four-month gap between this peak and the rate cut actually being implemented. The US ten-year peaked on 25/10/2022 and, if these averages hold, then we might see rate cuts in March and an equity market bottom in September 2023. An additional factor to bear in mind is that economic and stock market recoveries have historically coincided. If this holds, then the recession will likely need to be over before equities rally, which plausibly fits with this timeline.
What to buy when it’s time?
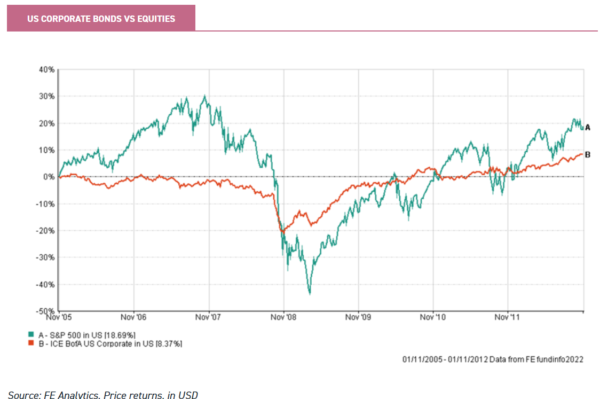
One interesting trend that comes out of Russell’s historical analysis is that corporate bonds tend to rally before equities do. This tends to happen close to the bottom for equity markets, with the lag being three months in 1921 and 1949 and 11 months in 1982. 1949 was an outlier, with a lag of 11 months. A similar pattern was seen after the 2007/2008 financial crisis. As the chart below shows, dollar corporate bonds bottomed out around five months before US equities. Sadly, the same pattern didn’t hold for sterling corporate bonds and the FTSE 100 Index, although it was true for high yield bonds in both currencies.
For this reason, we think investors who have ramped up cash might fruitfully consider adding to their fixed income exposure as a first recovery play. If the recent peak for the US ten-year turns out to be The Peak, then one key support for fixed income is already in place. We would add that investment trusts’ discounts offer an additional buffer against further NAV falls, which potentially makes them attractive as a first step back into the market. Anecdotally, we hear a number of wealth managers are looking at corporate bond funds at the moment and we note that credit spreads have recently seen some tightening. In the debt space, we would highlight NB Global Monthly Income (NBMI) and M&G Credit Income (MGCI).
NBMI is best thought of as a sophisticated strategic bond fund, in our view. The ability to invest in private debt and other non-conventional markets offers higher yields and greater diversification. As investments in the private markets can offer a higher yield for the same credit rating, there is also the diversification of sources of return into illiquidity and complexity as well as simply credit. Considering this alongside the payment of a monthly dividend we believe NBMI has a lot to offer income-seeking investors. NBMI has low duration, with credit spreads a more important driver of return. The portfolio tends to have a low credit rating which could provide strong returns in any recovery.
MGCI has an investment grade-quality portfolio, with the manager, Adam English, aiming to add returns by investing in private debt markets. The floating rate exposure means that the income available for distribution rises if rates do, while duration is very low, so prices in the portfolio should have limited negative impact. MGCI does have credit risk, which means that if spreads were to widen, there would be some negative impact to the NAV. However, Adam’s cautious approach to management and the high average credit rating in the portfolio should mean this impact is limited.
Turning to equities, it is important to recall that the above analysis of major bear market bottoms suggests that the economy generally needs to bottom out before the recovery begins. Additionally, we noted the likelihood of inflation remaining high and persistent. In this sort of environment, the operating environment for companies could remain very difficult even when interest rate hikes halt or cuts are imposed. If there is likely to be a lag between bonds and equities recovering, then it is likely to represent a period of earnings readjustments, with the impact of inflation moving through balance sheets and income statements across the market. Plan A is obviously to buy at the very bottom of the market. For those with enough self-awareness to doubt their ability to do this, a plan B is needed.
Averaging in to equity investment trusts seems like a sound strategy to us. The discounts to NAV could provide some downside protection while offering extra return potential once the recovery comes. Buybacks offer some modest NAV per share gains while you wait. Given the likelihood of a recession in the coming quarters and of inflation remaining high and persistent, we would expect something of a struggle to survive for companies, with the strongest eating the runts’ lunch.
In this case, the strategy of Edinburgh Investment Trust (EDIN), run by James de Uphaugh at Liontrust, could be well suited for the environment. One of James’s investment themes is Darwinism in the UK market. The current inflationary period has followed the shock of the Brexit vote and the coronavirus pandemic, and overall the picture has been challenging for UK companies, providing opportunities for market leaders to increase their advantages. When we met with him recently, James argued you don’t generally get good buying opportunities when the newsflow is good, and the UK market is already pricing in a recession. This means he is finding plenty of opportunities and seeing the advantages of being an incumbent and a market leader coming through in company results. He highlighted Greggs (down 35% year-to-date) and Whitbread (down 20%) as beaten-up stocks which were in very strong positions to advance at the expense of their peers. James thinks that while a recession is on the cards, it will likely be shorter and shallower than widely expected. EDIN sits in the UK Equity Income sector and trades on a discount of 7.2% at the time of writing, and we published a recent note on the trust.
Conclusion: Bull v Bear
The central case we have presented is that US Treasury prices may be near or past the bottom, and that going by historical relationships this could signal there is around another six months to go before equities bottom out too. However, a recovery in credit may come first and, indeed, may be underway already. If this is correct, then credit funds look interesting, and equity funds focussing on identifying quality companies able to steal market share in difficult periods may also be attractive – particularly if trading on a significant discount.
So what is the bull case? What if we are too bearish? Well, it could be that the strong consumer position we have highlighted above means the recession is shorter and less severe than feared. We have already seen forward energy prices recover from their alarming highs in September, and it seems likely the pressure on industry and consumers will be lower than expected. It could therefore be that small and mid-caps recover sooner. An interesting way to protect against this eventuality could be Miton UK Micro Cap (MINI). MINI is managed by Gervais Williams and Martin Turner and is tilted towards shorter-duration equities which are less exposed to faltering global supply chains. This strategy might be better suited to the initial stages of a recovery than a high-octane growth strategy which might require a sustained fall in inflation to prosper.
And what if we are too bullish? It is true that Russell Napier’s analysis found that the q-ratio of the S&P 500 (the ratio of market capitalisation to asset replacement cost) fell to around 0.3 after the major market bottoms. In 2009 it didn’t get that far, bottoming out at c. 0.6, but that is still well below the current ratio of 1.3. By this metric, the sell-off hasn’t even begun. A bear could also point to the fact that the S&P 500 is only down around 20% so far, with the 2008/2009 crash seeing the index fall by around 50%.If there is another leg down, then perhaps the only solution is to stay on the sidelines with defensive trusts like Ruffer (RICA) or opportunistic strategies like BH Macro (BHMG) to take advantage of volatility.
In our view, there are clearly short-term dangers and the road ahead is not clear. However, discounts are now very wide across most investment trust sectors and it is reasonable for investors to be looking for opportunities to step back in. In the coming weeks, we will be reviewing the state of discounts across the sector and looking at which have widened the most this year.

Disclaimer
This is not substantive investment research or a research recommendation, as it does not constitute substantive research or analysis. This material should be considered as general market commentary.
Brokers Commentary » Commentary » Investment trusts Commentary » Investment trusts Latest » Latest » Mutual funds Commentary
Leave a Reply
You must be logged in to post a comment.