Oct
2023
You say potato
DIY Investor
12 October 2023
Despite being in the same sector, investment trusts in the UK Equity Income sector could be more lowly correlated than you might think…by Josef Licsauer
The furious enmity between those who say ‘scone’ and their bitter enemies, who say ‘scone’ (ask a British person if this doesn’t make any sense) is a well known trope for those trying to capture the peculiarities of these islands at their most idiosyncratic. Fortunately, having been raised in Cornwall, I am party to the truth which is that the correct pronunciation, and the only acceptable one, is ‘scone’.
I’m sure you’re wondering what the point is here, so, aside from the sweet treats, let’s get to it, which is a focus on the UK equity income sector and the word different. This is a particularly competitive space, whereby there are 20 trusts in the AIC sector and countless open-ended equivalents. Most, if not all, managers will say, “We offer something different compared to peers” or “Our strategy is truly differentiated from our peers”.
But what does different actually mean in this context? If the strategies are truly differentiated, we could argue that means they have the potential to help diversify a portfolio, something many investors seek, in the hopes of reducing their portfolio’s risk level. One way we could test this is to look at how each underlying investment interacts, otherwise known as its correlation. This leads to another interesting question – can you really get a good level of diversification or low correlation when investing in just one UK sector? As the proof is often not found in the pudding, rather in the eating, we put this theory to the test.
We ran a correlation matrix on all the trusts in the UK equity income sector, over five years, using cum fair NAV monthly returns. To clarify, correlation shows how strong and in what direction each variable (here investment trust) is related, the ranges of which are known as correlation coefficients. A score of 1.0 means the variables have historically moved together in perfect sync, whereas a score of -1.0 means they’ve moved in precisely opposite directions. In theory, if you add two variables, or in this case trusts, that have correlations below 1.0, it can help reduce the portfolio’s overall risk profile. You can see the full matrix in the link, but in the table below, we show the 15 lowest correlation pairs that emerge.
15 lowest correlation pairs in th eUK Equity Income sector
| TRUST PAIRS | CORRELATION |
| Finsbury Growth & Income vs Temple Bar | 0.57 |
| Finsbury Growth & Income vs abrdn Equity Income | 0.63 |
| Finsbury Growth & Income vs Chelverton UK Dividend | 0.65 |
| Finsbury Growth & Income vs Diverse Income | 0.67 |
| Finsbury Growth & Income vs Merchants | 0.67 |
| Troy Income & Growth vs Temple Bar | 0.67 |
| Finsbury Growth & Income vs Lowland | 0.69 |
| Finsbury Growth & Income vs Edinburgh Investment | 0.70 |
| Troy Income & Growth vs Chelverton UK Dividend | 0.73 |
| Troy Income & Growth vs abrdn Equity Income | 0.75 |
| Troy Income & Growth vs Diverse Income | 0.76 |
| Troy Income & Growth vs Edinburgh Investment | 0.77 |
| Troy Income & Growth vs Lowland | 0.77 |
| Finsbury Growth & Income vs CT UK High Income | 0.78 |
| Temple Bar vs Dunedin Income Growth | 0.78 |
Source: Morningstar
There are no negative correlations when looking at the UK equity income trusts, which is what we’d expect. Even different countries’ equity markets tend to be positively correlated. Clearly, the correlation numbers will not be as stark when looking at just one sector versus comparing two different sectors like AIC Japan and private equity for example. Nevertheless, there are a number of interesting findings which we will discuss below.
One of the first things that sticks out is how lowly correlated Finsbury Growth & Income (FGT) is against most of its peers. FGT is a highly concentrated investment trust and its lead manager, Nick Train, makes a point of ignoring the benchmark entirely. He invests in companies which he believes will perform well regardless of their weighting in the index, so the portfolio, which stands at just 22 stocks, fully reflects his highest conviction ideas. FGT’s active share is high versus others in the sector, which is one of the reasons it appears to be so different.
Another reason is down to the style in which Nick invests. While the UK market is deemed light on technology names, particularly in the large-cap space, it’s also considered to be lacking in growthier-style investments in general. As Nick’s investment style is very much tilted to growth, it performs very differently to more core-focussed or value-oriented trusts.
Examples that help illustrate this point are abrdn Equity Income (AEI) and Diverse Income (DIVI). FGT has a correlation of 0.63 and 0.67, respectively, suggesting that there would be a greater reduction in volatility and risk by adding these trusts together. However, this is very simply put, as there are many other factors to consider, but it’s clear that FGT is not your typical equity income trust. It is worth noting that FGT has a very low yield for the sector and could be considered something of an outlier. It certainly might not be delivering the sort of yield an income investor is looking for at 2.3%, so investors might not find this sort of diversification attractive.
AEI and DIVI both adopt a more value-oriented approach, preferring stocks trading at attractive valuations with the potential to surprise positively on cash flows and dividends, which in turn raises the share price upon recognition by the wider market. Given the differences, you’d expect FGT to perform better in the rising markets when growth is in favour, but when there is a rotation in styles, we’d expect AEI and DIVI to pick up more quickly. A similar point can be made for Temple Bar (TMPL), which boasts the lowest correlation in the sector, against FGT, owing largely to its preference for value investing.
Troy Income & Growth (TIGT) is another trust that demonstrates a low correlation against peers, driven by its style of investing. The managers focus more on capital preservation, favouring the larger, more high-quality companies, meaning they steer away from having an out-and-out style bias. TIGT instead balances stocks that boast a mixture of quality, growth, and yield, as well as some defensive characteristics underpinned by things like operational resilience and dividend growth potential.
It’s clear from the data that some low correlation pairs can be found in the UK equity income sector, and the growth/value distinction is one factor behind this. But are there other factors driving differences in correlation, whether those displayed over the past five years or which might emerge in future? One of the advantages of the closed-ended structure is to allow managers a greater deal of flexibility with strategy and structure while still producing a yield. The table below shows how the sector looks based on some differentiating factors: ex-UK exposure, ex-large-cap exposure, gearing, and yield. This information has been generated from Morningstar and may be imprecise at points based on how they calculate things like gearing or cash, but overall, it gives us a fair overview and useful indication of the correlation drivers.
Differentiationg factors
| INVESTMENT TRUSTS | DIVIDEND YIELD (%) | GEARING (%) | NON-LARGE-CAP EXPOSURE (%) | NON-UK INVESTMENTS (%) | CORRELATION VERSUS INDEX |
| abrdn Equity Income | 7.5 | 16.8 | 51.3 | 19.8 | 0.94 |
| BlackRock Income & Growth | 4.0 | 6.3 | 36.6 | 11.0 | 0.97 |
| Chelverton UK Dividend | 7.7 | 56.9 | 72.1 | No data | 0.86 |
| City of London | 5.1 | 3.8 | 30.3 | 15.0 | 0.97 |
| CT UK Capital & Income | 4.1 | 7.3 | 51.6 | 20.0 | 0.95 |
| CT UK High Income B Share | 0.0 | 14.2 | 43.9 | 19.2 | 0.95 |
| CT UK High Income Ordinary | 6.8 | 14.2 | 43.9 | 19.2 | 0.94 |
| Diverse Income | 5.0 | 0.0 | 80.5 | No data | 0.88 |
| Dunedin Income Growth | 4.9 | 8.0 | 48.0 | 18.3 | 0.92 |
| Edinburgh Investment | 3.9 | 4.4 | 41.0 | 9.2 | 0.96 |
| Finsbury Growth & Income | 1.0 | 1.0 | 36.8 | 16.8 | 0.79 |
| Invesco Select UK Equity | 4.7 | 6.5 | 47.8 | 14.4 | 0.95 |
| JPMorgan Claverhouse | 5.1 | 6.5 | 29.4 | -1.5 | 0.96 |
| Law Debenture Corporation | 3.8 | 8.1 | 51.6 | 18.8 | 0.95 |
| Lowland | 5.5 | 10.2 | 74.6 | -2.9 | 0.94 |
| Merchants | 5.2 | 11.1 | 66.0 | -4.9 | 0.95 |
| Murray Income | 4.5 | 10.1 | 42.1 | 15.4 | 0.94 |
| Schroder Income Growth | 4.8 | 12.8 | 45.6 | -7.6 | 0.97 |
| Shires Income | 6.1 | 22.2 | 47.2 | 22.5 | 0.94 |
| Temple Bar | 4.1 | 8.2 | 49.7 | 22.6 | 0.92 |
| Troy Income & Growth | 2.9 | 1.2 | 36.0 | 13.9 | 0.85 |
Source: Morningstar
One factor that differentiates trusts and might lead to uncorrelated returns is market capitalisation. Open-ended equity income funds tend to focus on the FTSE 100, as this market tends to offer the highest yields. Closed-ended funds can use a variety of means to deliver a higher yield while investing in mid and small caps. This includes gearing, split share classes, and the use of reserves to pay an income. This certainly leads to more growth potential over the long run, and it might lead to lower correlation in some circumstances.
AEI and DIVI are good examples of this. The managers of both trusts invest more than most peers in non-large-cap stocks, primarily via small-cap stocks. Versus a trust like FGT, for example, which prefers to invest in the larger business, it’s a clear differentiator.
Let’s also take another look at TMPL. Part of the reason it’s lowly correlated with some peers is its style bias. But it also comes down to how the new managers, RWC Asset Management, invest. The RWC team took over the trust in 2020, led by Nicholas Purves and Ian Lance, and invest right across the FTSE 350. In the three years they’ve been managing the fund, versus three years prior, exposure to small caps has been materially reduced and while the allocation to the larger names has increased, exposure to mid-cap stocks has increased more. Based on data from Morningstar, it currently has the highest exposure to medium-sized companies in the sector, possibly contributing to the low correlation to its peers.
Market capitalisation can’t always bring diversification, often small, mid, and large caps move together. Not only that, but the choice for active managers in the UK is surprisingly small. Once you exclude investment trusts from those listed on the FTSE All Share, the number of companies drops from 575 to 381, and when you also consider the yield requirement of an equity income trust, stock selection can be quite restricted. Some managers, therefore, look even further afield for opportunities. They may make use of their limits to invest in companies overseas, in the hopes they identify businesses offering something those listed in the UK cannot.
You can see from the table above that Shires Income (SHRS) and TMPL have some highest exposures to non-UK stocks, with roughly 22% invested overseas. Though generally speaking, most trusts don’t go significantly above 20% (that being the limit expected under sector rules).
We recently spoke with David Moss, the new manager of CT UK High Income (CHI), who is one of the managers with a high overseas weighting. David argues that while there are plenty of opportunities in the UK, you need to be open-minded about companies overseas. He will invest overseas for scale or dominance, if an equivalent business cannot be found in the UK, like semiconductor manufacturer ASML, for example. Having more invested overseas could be one of the reasons CHI is more lowly correlated against. We think that having a portion invested overseas comes with its own risks, but it has the potential to reduce the reliance on solely one economy doing well, as well as differentiating the portfolio against peers.
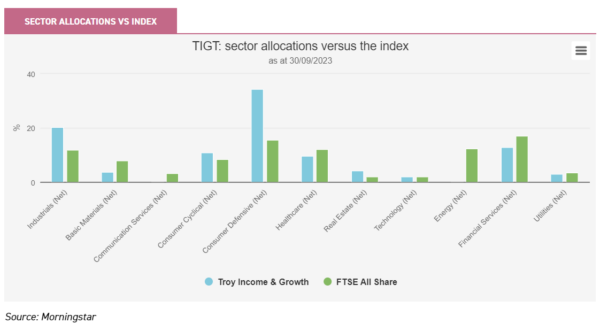
We’ve spent a good deal of time looking at correlation versus peers, but what about the index? We’ve already noted why TIGT’s style of investing demonstrates low correlation against peers, but aside from FGT, which arguably is an outlier in the UK equity income space, it has also had the lowest correlation versus the FTSE All Share Index.
Troy’s overarching philosophy—capital preservation—is something the managers employ across each strategy, which means they avoid capital-intensive businesses, including cyclical banks as well as oil, gas, and mining stocks. The managers target companies with less volatile cash flows and recurring revenues, including overseas revenues, (the latter in particular supports the low correlation). Given such a highly active approach, TIGT tends to have different sector allocations versus that of the index, something we’ve highlighted in the below chart.
Conclusion
Looking at the whole sector, the general picture is that of a fairly tightly correlated bunch of trusts. The average cross-correlation in our entire matrix table is 0.90. To check whether this average was biased due to a few outliers like FGT, we removed the 5% lowest and 5% highest cross-pair correlations, but the average remained the same. It is worth noting that a correlation of 0.9 conceptually means that 0.9 x 0.9 of the variation in a trust’s past returns is explained by the movements of the other trusts, i.e. 81%. This means there is scope for around a 20% difference on average in returns between any two trusts in the sector, a meaningful difference to say the least (technically minded readers might know this is referred to as the r-squared).
We have pinpointed some trusts with notably low correlations and explained the potential sources of that differentiation, so depending on your own investment objectives, there are certainly lower correlated options within the UK equity income space. Having a collection of lowly correlated assets should help reduce a portfolio’s risk and volatility profile, in theory, but it’s important to note that correlation coefficients shift over time. What’s worked in the past won’t necessarily work in the future and the further out you look, the more correlated assets are likely to become given changes in markets, managers, and overall investment processes. We think it’s sensible to ensure a portfolio is well-diversified and reviewed regularly.

Disclaimer
This is not substantive investment research or a research recommendation, as it does not constitute substantive research or analysis. This material should be considered as general market commentary.
Brokers Commentary » Commentary » Equities Commentary » Investment trusts Commentary » Investment trusts Latest » Latest
Leave a Reply
You must be logged in to post a comment.