Sep
2021
What will define markets for the remainder of the year?
DIY Investor
25 September 2021
 As economic expansion presses forward, we are focused on five key considerations.
The defining market questions heading into year-end
We have our eye on five key questions that will influence markets through the end of the year.
1. Can we get over the COVID-19 hump?
The Delta variant spread rapidly over the summer, but so too did vaccine penetration. Over 40% of the world has now received at least one vaccine dose, compared to just 10% in June. And while vaccines haven’t stopped rising case counts, they’ve done much to protect against the worst-case outcomes (rising hospitalizations and mortality rates).
Importantly, policymakers in highly vaccinated countries have been able to keep their economies open. Outside of airline travel, mobility in the U.S. economy and close contact spending have remained pretty much constant during the Delta wave. That said, we believe the COVID-19 pandemic is becoming endemic, and with each new wave, the negative impacts on the economy seem to be diminishing.
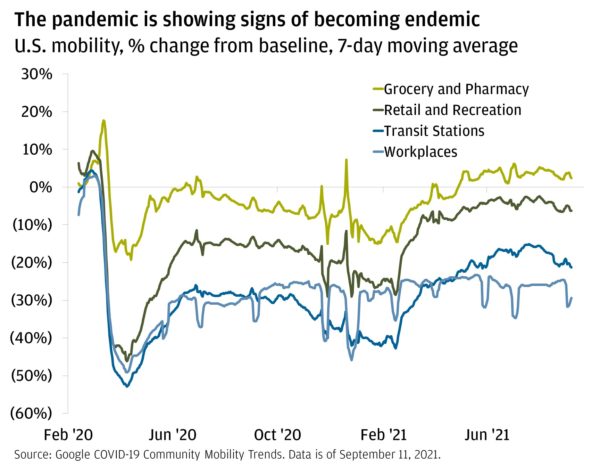
This chart shows the trends of four U.S. mobility variables: grocery and pharmacy, retail and recreation, transit stations, and workplace, from February 17, 2020, to September 11, 2021. More specifically, it plots the daily percent change (7-day moving average values) of each of these variables relative to baseline. U.S. workplaces started off at -7.3% from baseline, rising to 2.4% in early March 2020. Transit stations started at -1.3% from baseline, then had a relative peak at 4.3% by early March 2020. Grocery and pharmacy started at 1% of baseline, had a relative peak, later and stronger than the other variables, at 17.5% in mid-March 2020. Retail and recreation started at 6.3% of baseline, had a small decline and then increased to relatively peak at 9.1% in early March 2020. All four of the variables rapidly declined in early April to different levels, transit stations being the furthest from baseline at -52.7%, followed by workplaces at -49%, retail and recreation at -46%, then grocery and pharmacy at -19%. Moving forward, all variables began their ascents, experiencing another relative peak in early July 2020. Grocery and pharmacy rose to 1.7%, followed by retail and recreation at -12.4%, transit stations at -27.7%, then workplaces at -29.9%. Workplaces soon experienced a slight dip to -37% a few days later. By the end of November, there began some volatility with sharp dips and peaks; the variables then landed at their second all-time lows in mid-February 2021. Transit stations were at -42.7%, workplaces were at -35.4%, retail and recreation at -28.5%, and finally, grocery and pharmacy at -14.6% from baseline. Since then, all variables have shown increasing trends, workplaces being the weakest, followed by transit stations, retail and recreation, and grocery and pharmacy being the strongest. The end of the data shows the variables in that order, with values of -30%, -21%, -6%, 2% from baseline, respectively. There, the data shows signs of slowing, but to level
As we get over the Delta hump, we think the reopening trade could find a second wind. Cyclical areas, such as materials and services-oriented consumption, stand at the nexus of this potential leg higher.
But not all reopening trades are created equal. We’re still shying away from energy and airline segments of the stock market, as both have added debt and burned cash throughout the pandemic. Further, likely permanent damage to business travel and an ongoing desire to lower demand for fossil fuels give us pause on these areas.
2. What will Washington actually deliver?
There is a laundry list of Congressional tasks that need to get done by year-end. In addition to the oft-mentioned infrastructure bill and the budget reconciliation, Congress also needs to resolve the debt limit to prevent a government shutdown, negotiate next year’s budget, and consider extending or terminating the plethora of COVID-19-related programs set to expire. We’re tired already.
Consensus expects about $2.3 trillion in new fiscal spending to be signed into legislation this year (we’ve penciled in a more conservative $1.5 trillion). But the economic impact will only go so far—a $2.3 trillion spending package over 10 years would increase federal spending by 5% per year (not exactly life changing).
More widely telegraphed, though, is how it’ll be paid for. The tax and spend plan released by House Democrats this week gave us a clue, calling for a 26.5% statutory corporate tax rate (only a touch higher than the 25% we’ve already baked into our outlook) and a 25% capital gains rate for high earners (substantially lower than President Biden’s initial proposal). The next proposal to watch for will be from the Senate Finance Committee.
Importantly, higher capital gains taxes tend to have a fleeting impact on markets. And while a corporate tax hike would present a headwind for all sectors, S&P 500 earnings still stand to grow another ~10% next year when factoring in the potential changes—and that’s on top of estimated ~45% growth this year.
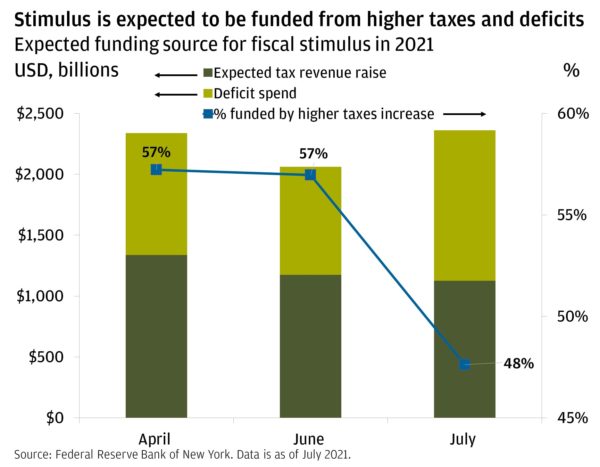
This chart shows the expected funding source for an increase in fiscal spending for 2021. It shows data from April, June and July of 2021. In April, it was expected to raise $1.34 trillion of tax revenue and have a deficit spend of $1 trillion, 57% of which is funded by the tax increase. In June, it was expected to raise $1.18 trillion of tax revenue and have a deficit spend of $888 billion, 57% of which is funded by the tax increase. And in July, it was expected to raise $1.13 trillion of tax revenue and have a deficit spend of $1.24 trillion, 48% of which is funded by the tax increase.
3. Are Chinese officials going to reverse course on policy and regulatory tightening?
Although China’s economy was the first major one to emerge out of the crisis last year, growth in China is in a major slump, largely because policymakers took a more restrictive stance this year (its credit impulse is about as tight as its been over the last decade) and outbreaks of COVID continue across the country. Add to that surging input costs and a hoard of regulatory shifts, and it’s not too surprising Chinese assets have been some of the worst performers this year. Internet stocks in particular are down over 50% from February highs.
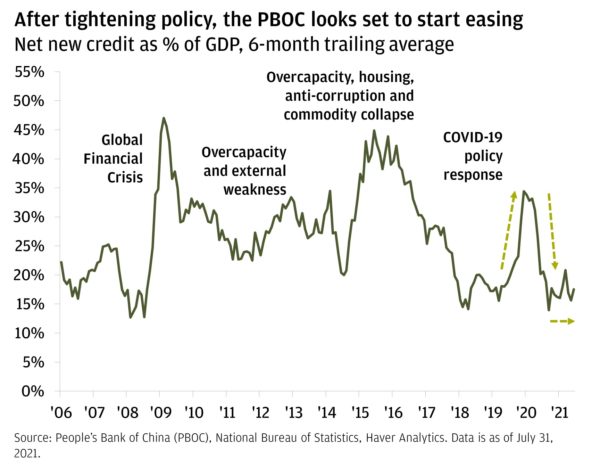
This chart shows the 6-month trailing average of China’s net new credit as a percent of GDP from 2006 to August 2021. The value started at 22% in February 2006. Since then, there were three major events that caused relative highs then lows in net new credit. In early August 2008, the net new credit was 12% of GDP, then spiked to 47% by March 2009. This is attributed to the Global Financial Crisis. It began to lower from there to a relative low of 22% by November 2011. Credit increased again to 32% in February 2013, then declined to 20% by August 2014. These troughs are attributed to overcapacity and external weakness. The next larger relative peak occurred here when credit became 45% of GDP by July 2015 due to overcapacity, housing, anti-corruption and the commodity collapse. Credit decreased from here to 14% by May 2018, where it then began another ascent to 34% by February 2020. One month later, credit declined again to hit 14% by October 2020. This peak was a COVID-19 policy response, as now we see China’s credit impulse was at a decades’ low of 17% in July 2021.
China’s annual growth goal of 5% has been well telegraphed. A recent shift toward easing from the People’s Bank of China (PBoC) could foreshadow a further loosening of credit conditions and, possibly, a subsequent pick-up in growth. And while more regulatory moves are likely on the horizon, China’s onshore equity markets appear more insulated from further ire than offshore markets.
That all said, we continue to see compelling opportunities in investing in China over the long term, but investors may need to be willing to tolerate the near-term risks and have some patience. A diversified multi-asset approach across stocks and bonds can dampen volatility, and we are also specifically focused on areas of the market that are aligned to China’s policy priorities, such as automation, robotics, clean energy and EVs.
4. When will higher input costs matter for the expansion and corporate profits?
We don’t think profits will feel the pinch anytime soon. Profit margins are actually near 10-year highs, as revenues are surging along with input costs. And it’s all thanks to productivity growth.
Corporations have been able to make productivity enhancements during the pandemic (such as enabling efficient remote work and investing in technology) that have more than offset costs. So instead of just thinking about higher input costs in a silo, it’s also worth looking at measures such as unit labor costs, or how much a business pays workers to produce each unit it makes. Unit labor costs have actually fallen because increased output and efficiency are offsetting rising wages.
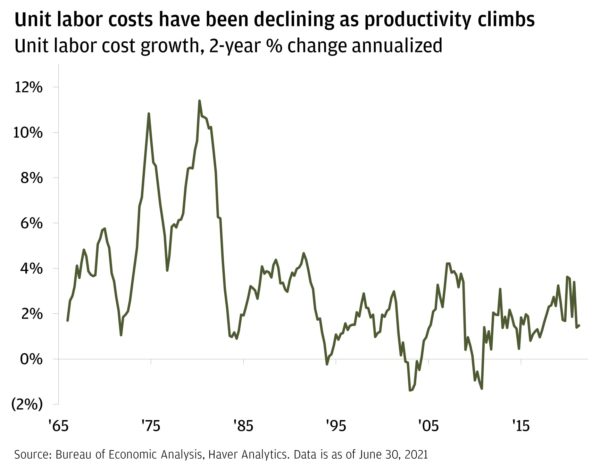
This chart shows the 2-year annualized percentage change of unit labor costs from 1966 to 2021. Over the years, as shown in the chart, labor costs have experienced significant fluctuations that have been triggered by different historical events. Mainly, these fluctuations are attributed to higher wages and/or higher productivity. On March 31, 1966, unit labor costs started at 1.65% and began their ascent, ending one year later in March 1967 at 4.12%. The increasing labor costs persisted, but remained rangebound between 3.58% and 5.08% for two years until they surged to 5.76% in March 1970. After reaching peak, labor costs plummeted down until they reached 1.05% in December 1971. However, following the all-time low, unit labor costs skyrocketed nonstop until they reached peak of 10.83% in December 1974. In the following year, costs declined sharply until they reached 3.90% in December 1976, when they skyrocketed once again and reached an all-time high of 11.41% by June 1980. Following the crest, labor costs declined to 10.23% in September 1981, and then continued to decrease until they reached another all-time low of 0.89% in June 1984. Following the extreme volatility of the previous years, labor costs increased gradually to 4.67% in September 1991. Once again, after a period of sustained increments, labor costs declined to -0.24% in March 1994. In June 1994, labor costs started to rise again and maintained rangebound until they reached another peak of 2.99% in June 2001. After a gradual increase, labor costs declined to a new all-time low of -1.39% in March 2003. Following the dive, labor costs inclined and reached another peak of 4.21% in June 2007, then went crashing down to -1.31% in December 2010. Following the tumultuous period, they surged again to a peak of 3.09% in December 2012. Afterward, they gradually declined until they reached 0.46% in December 2014, then slowly increased again to 3.40% in December 2020. Finally, unit labor costs declined significantly
This gives us confidence in the durability of earnings growth through this year and next—a key tenet of our view for more upside in stocks.
5. Is the Federal Reserve going to rush to the exit?
We don’t think so. Fed Chair Powell and his band of policymakers have been explicit about their data-dependent approach, and have taken leaps to ensure future moves are well telegraphed. Importantly, the Fed is not tone deaf and will not begin removing support unless the recovery is on stable enough footing.
That said, the U.S. economy has made substantial progress since the crisis (the labor market continues to heal even if Delta creates some speedbumps, and the consumer has proven resilient). We expect the Fed to announce tapering at its November meeting and formally begin the process in December.
Further, Powell has been very careful to cut a clear distinction between tapering and rate hikes, and the latter isn’t even a topic of conversation yet. The market currently expects the first rate hike to come in Q1 2023—about in line with the Fed’s mandate for an unemployment rate well below 4% and inflation averaging 2%.
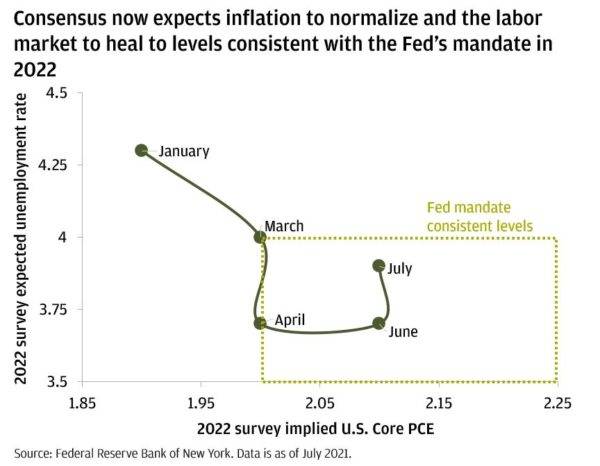
This chart shows the progression of expectations from January 2021 through July 2021 for the unemployment rate and Core PCE rate in 2022. As unemployment comes down, inflation is expected to rise. In January 2021, 2022 unemployment was expected to be at 4.3%, while 2022 inflation was at 1.9%. In March 2021, 2022 unemployment was expected to end up at 4%, and 2022 inflation was expected to be around 2%. In April 2021, 2022 unemployment was expected to decline to 3.7%, while 2022 inflation was expected to remain at 2%. In June 2021, 2022 unemployment expectations were expected to be around 3.7%, while 2022 inflation was expected to be around 2.1%. Finally, in July 2021, expectations are for unemployment to hit 3.9% in 2022, while inflation steadies around 2.1%.
This gradual and well-telegraphed removal of central bank liquidity, a continued rollover in “transitory” inflation forces, and a constructive growth outlook (even if some momentum is delayed) should push rates off their lows.
Where we stand:
We’ve moved beyond recovery and into expansion. As we head into the home stretch of 2021, our constructive outlook leads us to continue favoring stocks over bonds. And as vaccine penetration enables continued reopening and bond yields rise off their lows, we see another leg higher in cyclical areas of the market. At the same time, growth stalwarts, such as tech and healthcare, tend to outperform in mid-cycle environments.
Moreover, what we don’t like is just as important as what we do. Cash continues to be our least favored asset class. And given bond yields are headed higher, we’re cautious on long duration core fixed income, instead favoring a shorter duration tilt and leveraging active managers to navigate tight credit spreads.
All market and economic data as of September 2021 and sourced from Bloomberg and FactSet unless otherwise stated.
We believe the information contained in this material to be reliable but do not warrant its accuracy or completeness. Opinions, estimates, and investment strategies and views expressed in this document constitute our judgment based on current market conditions and are subject to change without notice.
RISK CONSIDERATIONS
- Past performance is not indicative of future results. You may not invest directly in an index.
- The prices and rates of return are indicative, as they may vary over time based on market conditions.
- Additional risk considerations exist for all strategies.
- The information provided herein is not intended as a recommendation of or an offer or solicitation to purchase or sell any investment product or service.
- Opinions expressed herein may differ from the opinions expressed by other areas of J.P. Morgan. This material should not be regarded as investment research or a J.P. Morgan investment research report.
IMPORTANT INFORMATION
All companies referenced are shown for illustrative purposes only, and are not intended as a recommendation or endorsement by J.P. Morgan in this context.
The information presented is not intended to be making value judgments on the preferred outcome of any government decision.
This material is for information purposes only, and may inform you of certain products and services offered by private banking businesses of JPMorgan Chase & Co. (“JPM”). Products and services described, as well as associated fees, charges and interest rates, are subject to change in accordance with the applicable account agreements and may differ among geographic locations. Not all products and services are offered at all locations. If you are a person with a disability and need additional support accessing this material, please contact your J.P. Morgan team or email us at accessibility.support@jpmorgan.com for assistance. Please read all Important Information.
Leave a Reply
You must be logged in to post a comment.