Jun
2023
Under pressure
DIY Investor
9 June 2023
We identify the equity trusts which have delivered the best downside protection in recent years…by Thomas McMahon
Investors we speak to seem to view the current moment as a waiting phase: we are waiting for the market to reveal its next move. And we fear that move is as likely to be down, as up. Economic data tells a puzzling picture: on the one hand, the UK economy seems to be fairly strong, with retail spending holding up and unemployment still very low.
The housing market is at least stable. But the corollary of this is inflation is remaining stubbornly high, with the gilt market implying the terminal rate of this hiking cycle is likely to be higher than feared and, therefore, a soft landing less likely. An extra complication is the potential divergence of the US cycle from that of the UK and the EU. Inflation is much lower in the US, and they may end up with rate cuts much earlier than we do on this side of the Atlantic.
This mixed picture is hard to read through into expectations for equities. UK fund managers tell us mid and small-caps are already pricing in a recession, which may mean the risks are more to the upside – i.e. a certain bad economic outcome, feeding through into earnings, is already in the price.
Looking globally, it is noteworthy that corporate earnings have beaten expectations on US and non-US developed indices in recent months, which may suggest there is scope for these markets to pop. Emerging market earnings, however, have disappointed.
On the negative side of the ledger, US indices look expensive on a forward or historical P/E basis, which suggests the market was ahead of analysts in seeing this earnings uptick, or perhaps that it is complacent about risk.
Either way, the risk to the US market seems more to the downside: plenty of good news is in the price, while the Federal Reserve has still not got on top of inflation definitively and may have to hike more. Additionally, the US rally this year has been driven by a small band of mega-cap tech stocks, meaning the index’s strength is vulnerable. And it is hard to see the UK and EU escaping if the US market does sell off, even if valuations are better.
This is because investors are likely to sell down everything in a serious correction, even before we consider the knock-on economic effects of a swooning US market. Overall, we think complacency is a real danger.
The markets are still largely being driven by inflation data and we would be wary of assuming that the last move is the definitive move: there could be plenty of volatility to come and plenty of action demanded by central banks before inflation is tamed. This could easily lead to another leg down for markets and means that thinking about how our portfolios would react in falling markets remains important.
Downside Protection
One of the components of our KTI Spider Chart, which has been appearing in our notes for the past year or so, aims to rank how trusts have performed in terms of downside protection. As ever, these scores are all relative rather than absolute, and relative to our expanded peer groups rather than the AIC sectors.
The score is made up of two underlying scores. First, we look at the downside capture metric, which is effectively an average of how an investment has performed in any down-markets during the period (five years, in this case). Then we supplement this by looking at the five worst months for the benchmark during the period and assessing the trusts’ performance in these.
We think this produces a superior score, as investors are likely to be most worried about an investment’s performance when general market returns are their worst, and this avoids trusts scoring highly by doing well in all the modest down-markets, but not in the worst moments. We simply equally weight these two components.
Below, we look at some of the leading trusts on this metric across the major equity markets and consider why they have done well. All quantitative metrics are backward-looking, so they only tell us what has happened, rather than what will happen. To build a model of what might happen in future, we need to consider why trusts performed how they did.
UK – Troy Income & Growth
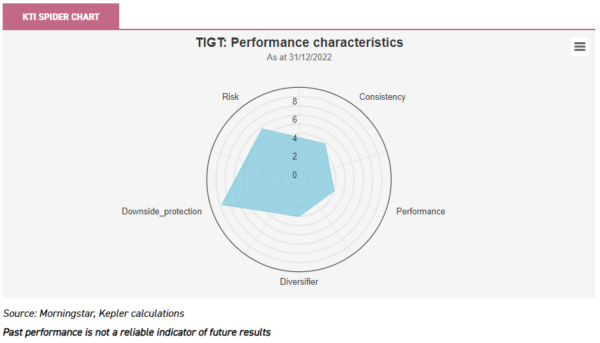
One of the standout performers in UK equities for downside protection has been Troy Income & Growth (TIGT). Managers Hugo Ure and Blake Hutchins make capital preservation a central aim of their strategy, and aim to generate sustainable dividend growth from a portfolio of high-quality businesses.
This focus on quality should itself provide downside resilience. It also is a contributing factor towards the managers avoiding cyclical sectors, such as energy and materials, which often pay high dividends but carry higher chances of temporary and permanent capital losses. The focus on quality was helpful over the five years to the end of 2022, a period which saw high-growth stocks and then cyclical value stocks rally sharply.
We think it could be much more suited to the current environment of weak economic growth and choppy fundamentals. We would expect the downside protection to be more stable than the performance, stemming as it does from the focus on finding companies with strong balance sheets and sustainable earnings
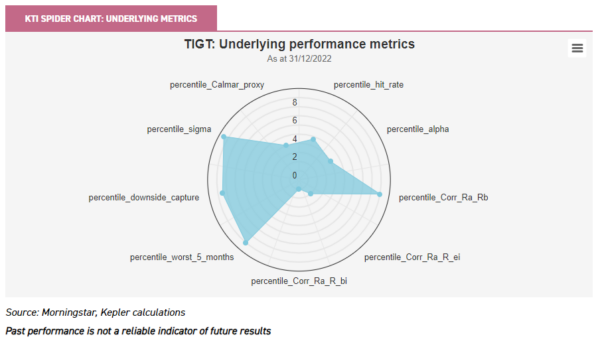
Below, we show the underlying scores behind the spider chart. On the left of the image, the downside capture and worst five months’ metrics are those which contribute to our downside protection score. You can see TIGT has scored very highly versus its UK equity peers on both metrics, as well as displaying very low relative volatility, as expressed by the high sigma score.
Meanwhile, the correlation to the UK market (Corr_Ra_Rb) has also been low, expressed by the high score in our chart (high being an attractive score).
USA – BlackRock Sustainable American Income
We think US equities look most precarious, behind perhaps emerging markets, because of a mixture of weak economic fundamentals, high valuations and high sensitivity to liquidity and momentum through the narrow concentration of the recent rally.
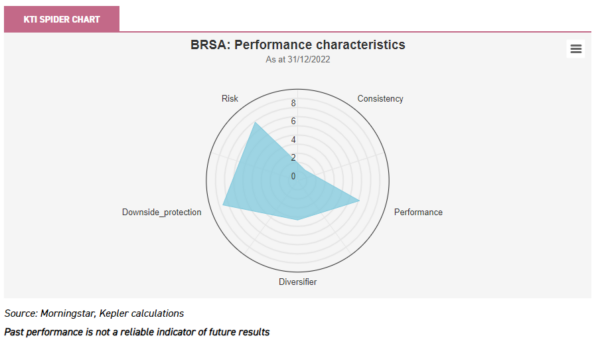
But it would be a brave – or, perhaps, foolhardy – investor who would eschew any equity holding in the world’s growth engine. BlackRock Sustainable American Income (BRSA) has the highest score for downside protection in our North America peer group, based on historical returns.
This has been accompanied by attractively low relative volatility and good performance. In fact, most of the trusts to have scored highly for downside protection have also performed well, which we think reflects the fact that avoiding the market blow-ups has been critical to returns in a period which saw the pandemic and the invasion of Ukraine and some wild market gyrations. This correlation might not be the same at the end of a five-year bull market.
Our five year period includes the repositioning in 2021, which saw BRSA take a greater focus on ESG factors within its portfolio. However, at the heart of the team’s strategy is a multi-cap value strategy with a strong valuation discipline and a preference for companies that pay dividends. This has been the case since the original team which managed BRSA came together over ten years ago, and continues to be the case today.
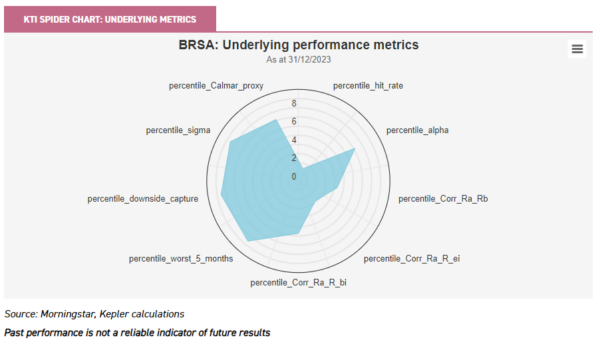
The more detailed chart below tells the same story. Notably, BRSA scored relatively low for consistency. This we measure using the hit rate, or the percentage of rolling 12-month periods over which the trust beat the benchmark. This score was brought down by 2020, during which BRSA underperformed as high-growth strategies rallied.
Asia – Pacific Assets
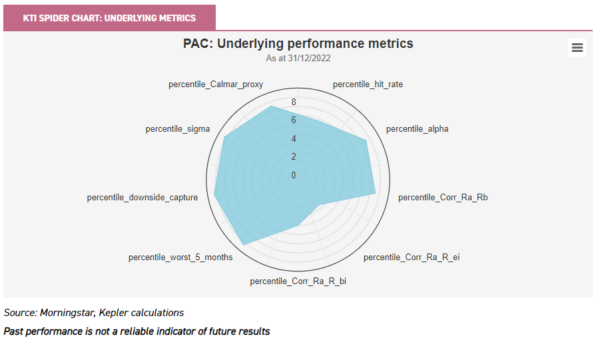
Pacific Assets (PAC) invests in equity markets in Asia with a long-term, conservative approach, aiming to identify high-quality businesses with high-quality management teams, which can compound wealth over the long run while minimising serious losses of capital. Given these priorities, it is unsurprising to see the trust score well for downside protection. In fact, it has scored fairly well across the board, as the below chart shows.
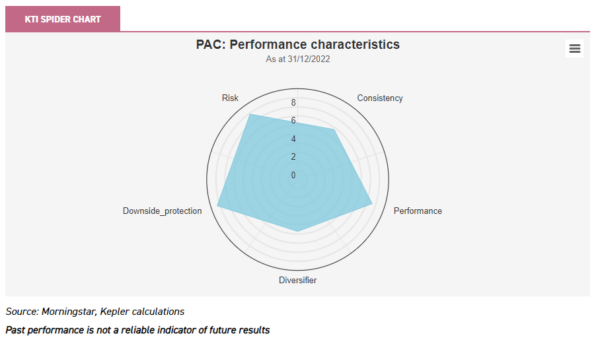
The trust has a highly-active approach, which has helped bring down the correlations shown below. One of the long-standing active positions has been to overweight India and underweight China, and both decisions have, overall, been contributors to performance in recent years which will affect the alpha score.
This may be less persistent than the downside protection metric, however, as active positioning like this tends to lead to lumpy periods of out and overperformance. Notably, China’s reopening rally has fizzled out in recent months and this may imply the underweight position in that country is going to work once more.
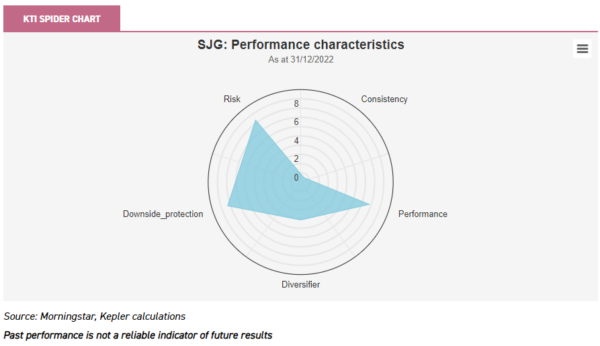
Japan – Schroder Japan Trust
The best downside performance in the Japanese sectors has been delivered by Schroder Japan (SJG). SJG is managed by Masaki Taketsume, who takes a very stock-based, bottom-up approach, identifying companies he believes are trading significantly below their fair value. As the chart below shows, SJG has done well in terms of performance in recent years, but the score for consistency was low.
The low consistency score seems to be due to the style bias of SJG: it has a greater sensitivity to the value factor than most trusts in the sector. SJG underperformed in the growth rallies of 2019 and 2020, before outperforming handsomely in more recent periods.
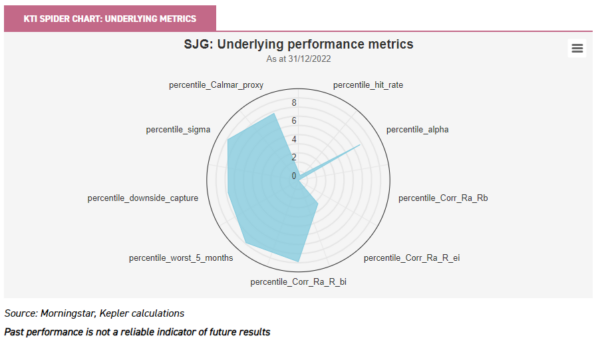
The chart below shows how our performance score is based on alpha, that is risk-adjusted outperformance of the benchmark. While alpha is calculated against beta, much of the time a low beta will be correlated with good downside performance, so it makes some sense that SJG has scored well on both metrics, particularly given what we discussed above about the severe sell-offs seen in recent markets.
Europe – Fidelity European Trust
Fidelity European Trust (FEV) (formerly Fidelity European Values) scored the highest for downside protection in the Europe sector. This is despite being geared for much of the period under review, which is testament to the good risk management and market timing of the management team, who take a flexible approach to gearing via CFDs.
FEV’s returns have been notably consistent, which comes through in its record of outperformance in the past seven completed calendar years, whatever the market environment. This feature is also picked up in our spider chart below.
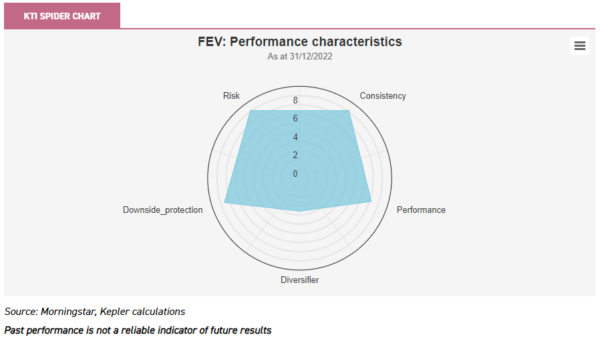
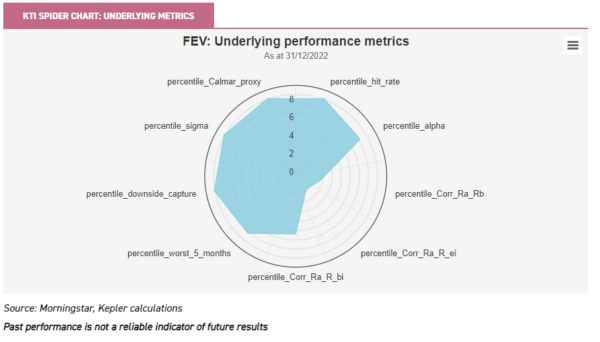
FEV’s record is excellent across all the metrics we calculate, as can be seen below, with the exception of the correlations underlying our diversification score. FEV has been relatively correlated to global equities (Corr_Ra_ei), as well the mainstream European equity benchmark (Corr_Ra_b). This reflects the adaptable strategy of the managers, which has seen the portfolio going with the flow of equity markets overall, albeit with strong downside protection when the markets have fallen.
Conclusion
Most of the strategies we have considered for their high downside protection scores have also performed better than average in their expanded peer groups over this period. We think this reflects the importance of performance during the sharp corrections we have seen in recent years to relative returns.
If we are to see another leg down in markets, we suggest managing to avoid the worst of it could be more important to relative returns over the next five years than outperformance in any recovery. The exception to this pattern is TIGT, which has a relatively low score for performance. This is due to the fact that value – i.e. energy, materials and banks – have led the UK market (particularly the first two).
To us, this seems like an accident of the UK market composition and the specific fall-out of the reflationary rally post-pandemic, plus the Russian invasion of Ukraine. These dynamics are unlikely to recur (we hope!). In our view, a focus on quality and on valuations looks attractive heading into any potential downturn.

Disclaimer
This is not substantive investment research or a research recommendation, as it does not constitute substantive research or analysis. This material should be considered as general market commentary.
Commentary » Equities » Equities Commentary » Investment trusts Commentary » Investment trusts Latest » Latest
Leave a Reply
You must be logged in to post a comment.