May
2023
Treasure hunters
DIY Investor
22 May 2023
What can a corporate raiser’s perspective tell us about private equity trusts? By William Heathcoat Amory
To advocates, the universe of listed private equity (LPE) trusts represents an attractive compounding machine. Like a wheel spinning down a hill, private equity trusts invest and recycle capital, sometimes throwing off cash in the form of a dividend, and grow capital at an attractive rate over the long term.
Capital is deployed by experienced dealmakers and strategies are developed to increase the profitability and scale of the business they have bought. Then, after a period of between three and five years – sometimes longer- in which the strategy is executed, the company is sold. At different points in the cycle, these sales are achieved via an IPO on the stock market or by selling to a strategic buyer, i.e. a trade sale, or to another private equity investor.
At different times, different buyers are active. Currently, with public markets largely closed to new business, and interest rate rises providing headwinds for strategic buyers, it would seem that other private equity buyers are the most obvious candidates.
The private equity industry is sitting on record amounts of ‘dry powder’, amounting to $1.32tn as at September 2021, according to Prequin, and private equity executives are heavily incentivised to invest capital. Not investing means that they do not have the potential to earn carry, private equity parlance for performance fees, typically achieved only AFTER investors in each fund have achieved an IRR of 8% per annum on invested capital.
At a recent capital markets day held by Hg Capital, managers of HgCapital Trust (HGT), we were struck by the sheer depth of resource that Hg can deploy to help their investee businesses deal with operational challenges, achieve growth and compete.
As with many other private equity managers, Hg have dedicated teams focussed on helping company management with recruiting, financing, strategy and product pricing. We could not help but feel sorry for competitors of their investee businesses, who, unless they have the benefit of in-house resource (unlikely), would have to pay handsomely for this sort of advice outsourced.
Like many private equity managers, Hg specialise in a specific sector or subsector, which has allowed them to develop a depth of experience which we think is unlikely to be found in other places, including competitors, management consultants and investment banks. Additionally, by specialising, each company can benefit from the experience of other portfolio companies.
During lockdowns, Hg organised a weekly CEO zoom call in which each portfolio company CEO shared ideas or experience of handling the fast-moving situation. Portfolio companies are also able to benefit from Hg’s proprietary data on industry trends in real time. In our view, this breadth and depth of support for investee companies goes some way to explaining why fees are higher in private equity than those charged by ‘active’ managers of public equity funds.
Getting carried away…
Hold on. This article is not supposed to be a paean to private equity: we have written plenty of those in the past… However, there are clearly plenty of investors who take the opposite view to ours and, given discounts to NAV, are not convinced enough to buy shares in any of the listed private equity trusts.
This is despite our view that listed private equity is actually, with apologies to Coca-Cola, ‘even better than the real thing’ . This article is not to soul-search why. Whether it is underlying leverage, fees or illiquidity, LPE dissenters will have their own reasons.
However, what happens if we look at these trusts in a different way, putting a proverbial stick in the compounding wheel? As ‘corporate raider’ Edward Bramson did with Electra, we imagine them not as highly-effective compounders of capital, but as trusts pregnant with value that just needs to be extracted.
To be clear, we are not proposing that the boards of these trusts decide to shut up shop and return capital to shareholders. However, making this assumption allows us to see how attractive discounts are at current levels; not just the share price discount to NAV, but also the latent value that might rest within portfolios too.
Bramson bounce
Bramson spotted an opportunity with Electra (ELTA, now listed on the LSE as Unbound Group). He saw that, whilst the headline discount appeared modestly attractive, it was really underlying valuations for the portfolio of investments that were most attractive and offered the most upside.
Not that he ever said as much and, in all his dealings with the board or other shareholders, Bramson never actually explained what his intentions were. At the second attempt, he persuaded other shareholders to vote him and one other director onto the board and, after a strategic review, terminated the management contract with one year’s notice.
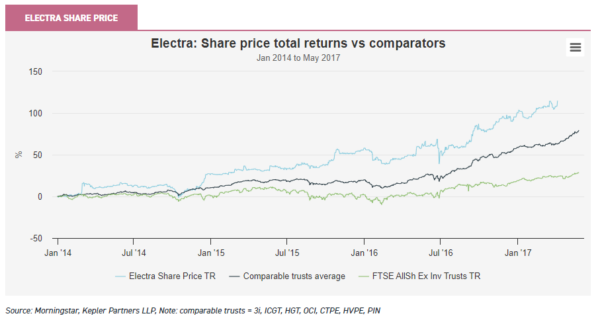
The managers, who were incentivised to crystallise investments through their carry arrangements, sold off the majority of the assets at hefty premia to prior valuations within the year, meaning that Bramson hardly had to lift a finger to see significant value realised. From the start of 2014, before Bramson first announced a stake, Electra shares delivered a share price total return of c. 115% to April 2017.
It should be noted that Electra Partners’ management contract ended in May 2017, but Morningstar’s data is corrupted by the large return of capital the trust made, subsequent to the end of the data below. As the graph below shows, this represented almost double the returns for comparable trusts and was significantly in excess of the FTSE All-Share Index’s return.
Imagine this…
The great benefit of LPE trusts is that they efficiently recycle capital back into new opportunities, which has, over time, delivered strong compounding of returns for investors in NAV terms. However, as we have highlighted, at times this good work has been undone by the discount widening.
In some ways, the fact that each trust is reinvesting capital over time obscures the underlying cash generation of trusts over time. Imagine that instead of reinvesting, capital was held in cash.
Therefore, the pregnant value in these portfolios would arguably be better illustrated, given the proceeds of sales remain as cash, rather than being merged back into a portfolio of illiquid investments with a subjective value (as detractors would say).
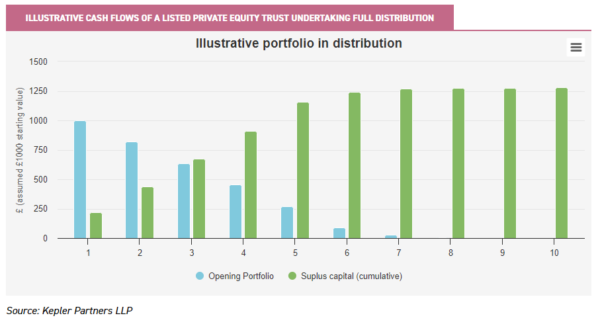
To this end, we have created a basic model of an illustrative private equity trust, with a fully-invested portfolio and net assets of £1,000. We assume no further investments are made and there are no outstanding commitments.
The main assumption we are making is that one-fifth or 20% of the portfolio is realised this year, at a 30% uplift to the prior valuation, therefore resulting in realisations of 26% of the opening portfolio. As we illustrate further below, based on the history of the last five years – which includes banner years for private equity, like 2021, but also relatively poor years, such as 2022 – this assumption is in line with the experience of history.
We assume that the rest of the portfolio does not change value, which we believe to be a conservative assumption, given that private equity-backed businesses tend to grow earnings faster than publicly-listed companies. We also assume an OCF of 4% of NAV, which should approximate to combined management fees and carry. Surplus cash is returned to investors each year.
The graph below shows the cash flows, with the first year seeing an opening balance of £1,000 and realisations during the year net of fees of £217. We assume that the same book value of the portfolio, i.e. £182 before uplifts, is realised each year for the first five years, a period which equates to the average life of a private equity investment.
Again, in view of the experience of Electra, if a trust was genuinely put into a wind-up situation, this may prove to be a very conservative assumption regarding how long it would take for sales to be achieved. The result of our model is that most of the capital is returned over the first five years, with a small outstanding rump left over with a low value.
On a NAV-to-NAV basis, the effect of approximately one-fifth of the portfolio being realised each year at a 30% uplift is to generate a net of fees IRR on the whole of c. 8% per annum. Given that this assumes no valuation increase for the portfolio over this time, we think this is reassuring and conservative, given there is the assumption of no earnings growth from the underlying portfolio over five years.
Instead, if we calculate the IRR of cash flows, which takes into account the fact that investors can buy these cash flows at a 30% discount to NAV, reflecting the current average for the LPE peer group, then things get a little more interesting. On this basis, we calculate that investors would achieve a net of fees IRR of 21% per annum. Again, it is important to note that this also assumes no growth from the underlying portfolio.
We think, and certainly hope, it is unlikely that any boards of the LPE sector will hit the ejector button, stop investing and return surplus capital to investors. As a result, investors are unlikely to generate the upper-case scenario of 21% p.a. returns, given that it requires all cash to be returned to investors, i.e. at a zero discount.
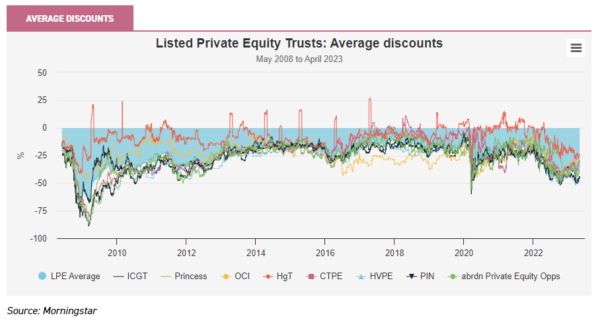
As the graph below illustrates, the average discount for our sample of trusts, which have long enough track records, is fairly wide relative to history. This sample has an average discount of 37% currently, against an average for the past ten years of 20%. If we rework the IRR to see a move in the discount to NAV from 30% to 20%, the IRR moves to 11%, according to our model.
Potential returns
The relatively conservative assumptions in our model give us a reasonable degree of confidence that the lower-bound return of 8% seems eminently achievable. Anecdotal evidence would suggest that secondary interests in private equity funds are transacting at discounts to NAV of mid-teens currently, which is wide, relative to history.
We understand part of the reason for this is the denominator effect, with institutions’ asset allocations toward private equity reaching limits, as much because of the strong performance from private equity funds as the weak performance from public equities. This is necessitating some rebalancing, which should prove transitory. As such, there seems no long-term impediment that would stop discounts to NAV for LPE trusts from narrowing over time towards their long-term average of 20%, thereby delivering an IRR to investors of 11%.
We would note that on the upside, there is clear potential for portfolio companies to grow earnings and, therefore, their valuations, assuming that valuations’ multiples remain steady. In addition, the long-term ability of LPE managers to reinvest capital remains undiminished and, therefore, shareholders should also benefit from the compounding of returns.
Taking all these points together, we believe that our analysis includes enough conservatism to illustrate low-teen percentage, steady-state share price returns over the long term from LPE trusts, which currently trade at wide discounts to NAV.
This is clearly a highly-attractive annualised return for any asset class. We accept that it is a niche area of investment, which large hedge funds and institutional asset managers may be unable to access because of the shares’ illiquidity, the opaque nature of portfolios and the high headline ongoing charges figures. For more nimble investors willing to take the long view and a risk that the future for private equity is bright, in our view the potential returns on offer mean that investors should take a closer look.
POST SCRIPT: Testing our assumptions
We are very aware that our entire argument above rests on two basic assumptions and it is important that we support these assumptions by using evidence from history, where available. Of course, we are aware that past performance gives no real guide to future events, so this model clearly only illustrates the opportunity and we would highlight that there are absolutely no guarantees that any of these illustrative returns will be achieved.
Uplifts
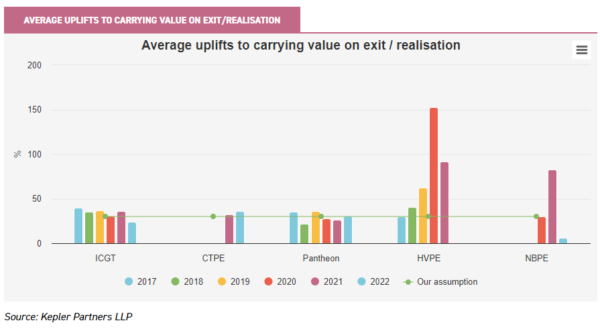
Below, we show the historical statistics from a sample of diversified LPE trusts, which we see as providing better evidence than highly-concentrated, directly-investing PE trusts, such as 3i. The graph shows the historical uplifts – on average or value-weighted average, depending on what is disclosed – on exits or realisations of investments, compared to the 30% level we assume in our model.
We observe that the past couple of years, especially with regard to HVPE and NB Private Equity (NBPE), uplifts have been significantly higher than average, largely through technology exposures and IPOs.
The average for ICG Enterprise (ICGT), CT Private Equity (CTPE) and Pantheon International (PIN) over the periods for which we have shown data is 32.5%. In the 2020 report and accounts, HVPE state that “for 16 consecutive half-year periods we have tracked the uplift achieved and this has consistently exceeded 30%”. For the five years to end 2022, NBPE stated that their average is a 37.2% uplift on IPO/realisations. Several managers we spoke to have stated that, in their opinion, a fair long-term expectation may be 30%.
This reflects not just that private equity managers can choose to sell their investment when they wish to, but also that valuation assumptions without a known willing buyer must clearly be more conservative than otherwise.
In our view, the evidence suggests that, whilst we may see a reversion to the mean over the short term, i.e. uplifts in 2022 to 2023 may be lower than historical levels thanks to the very high uplifts in 2020 to 2021, there is no reason to suggest that over the medium term, 30% may not still be a reasonable estimate. Certainly, the data below suggests that it is not too daring an assumption for our model.
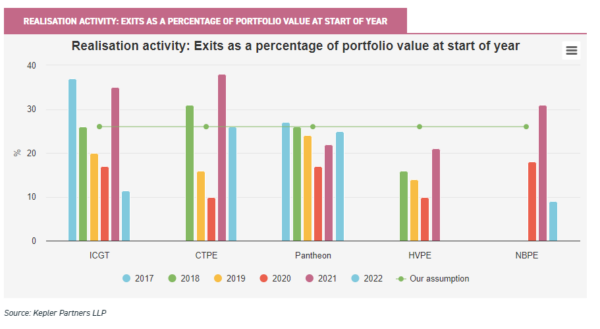
Exits as a percentage of opening portfolio
The other big variable is activity. A reasonable chunk of the value that private equity managers deliver is recognised on a sale. In some ways, this is how it should be, but it does expose LPE investors to the risk that if activity slows or stops, they may experience a dull few years in NAV terms. Certainly, deal activity slowed in the first half of 2020 for obvious reasons, but 2021 was such a strong year that it more than compensated. As the graph below illustrates, of those that have announced 2022 results, activity has slowed but not dropped off a cliff.
In our mind, the maths dictates that significant realisation activity validates average valuation uplifts achieved on exit. In 2023, we hear anecdotally that high-quality deals are progressing, but that in lesser-quality deals, or those companies that are less mature in private equity terms, there is a reluctance to bid up by buyers.
Equally, there is a reluctance for sellers to moderate their price expectations. Over time, confident sellers will rationalise that earnings growth will get them their valuation anyway, so why sell now? Our assumption of 25% of opening portfolio value being realised each year is punchy, but in our imaginary scenario, based on a motivated seller looking to crystallise value, it is not so far out of line with past experience.
ICGT, CTPE and PIN have each achieved an average 25% value realisation over the past five years. Anyway, when push came to shove, Electra’s managers achieved the whole thing within a year…
The final word…. (promise)
As a final word, many commentators, particularly FT journalists, complain of private equity managers being able to mark their own homework in terms of valuations and, therefore, call into question the attractiveness of the asset class at the current time. We would make two points.
Firstly, private equity managers charge fees only on commitments, not written-up valuations, so are not motivated to write up valuations unnecessarily. Secondly, our postscript graphs provide prima facie evidence that valuations are nothing other than conservative: it is very rare to hear of a realisation occurring below carrying value and we have not seen any change to that, despite the very changed circumstances global markets now find themselves in. Private equity is most certainly not immune to a recession.
However, our core belief, backed up by our analysis above, is that the latent value within private equity trusts, as well as their wide discounts, means that investors stand to achieve reasonably good share price returns. This is even when making no assumptions on underlying earnings growth.

Disclaimer
This is not substantive investment research or a research recommendation, as it does not constitute substantive research or analysis. This material should be considered as general market commentary.
Alternative investments Commentary » Brokers Commentary » Commentary » Investment trusts Commentary » Investment trusts Latest » Latest
Leave a Reply
You must be logged in to post a comment.