Aug
2022
The world for sale
DIY Investor
19 August 2022
While investment trusts are lagging their open-ended cousins in the global sector, their discounts may provide an attractive entry point….writes David Johnson
Global markets have just endured a tumultuous eight months. From near double-digit inflation across the globe to further lockdowns in China and another war in Europe, investors have needed to grapple with numerous macro risks. In this note we review the performance of the investment trust space during the last 12 months compared with the performance of its open-ended equivalent. Specifically, we compare the AIC Global sector to the Investment Association Global sector, looking at how each group of global large-cap equity strategies has held up, and how the investment trust universe offers unique advantages over its open-ended equivalent.
Squaring up
Over the last 12 months we find that the open-ended universe has held up better than the closed-ended one, with the average global open-ended fund down less in a falling market. This is in line with what we might naturally expect because trusts can take on gearing, and doing so leaves their NAV more exposed to market falls. The biggest factor in determining an individual strategy’s performance was its growth or value bias, with the average 12-month NAV returns of both open and closed ended funds having a strong negative correlation of -0.9 to the Morningstar style score, implying that the greater the growth bias, the greater the underperformance (although as we discuss below, on average both sectors have a very similar growth exposure). Yet in the case of both the open- and closed-ended peer groups, investors would have been on average better served by buying the index, as neither peer group average has been able to outperform the MSCI ACWI over the last 12 months.
Sector Returns
| ONE YEAR | FIVE YEARS | |||
| NAV total return (%) | Std dev (ann. %) | NAV total return (%) | Std dev (ann. %) | |
| AIC Global average | -12.2 | 15.0 | 34.5 | 13.3 |
| IA Global average | -3.2 | 14.6 | 49.1 | 13.4 |
| iShares MSCI ACWI ETF | 2.5 | 12.8 | 59.5 | 12.9 |
Source: Morningstar, as at 31/07/2022
Past performance is not a reliable indicator of future results
Within the closed-ended universe, Global Opportunities Trust (GOT), previously Edinburgh Investment Partners, and Scottish Investment Trust (SCIN) have held up better over the last 12 months, having had the strongest value biases in the sector. SCIN is in the process of being merged with JPMorgan Global Growth & Income (JGGI), which sits in the global equity income peer group. And while investors can actually invest in GOT, they will likely find it difficult given the trust’s small size (of c.£100m, making it the second smallest investment trust in the sector).
AIC Global Sector Returns
| ONE YEAR | FIVE YEARS | |||
| NAV total return (%) | Std dev (ann. %) | NAV total return (%) | Std dev (ann. %) | |
| Global Opportunities Trust | 11.4 | 5.6 | 18.0 | 9.9 |
| Scottish Investment Trust | 7.8 | 15.3 | 15.9 | 13.2 |
| Brunner | 2.7 | 15.1 | 53.3 | 15.1 |
| AVI Global | 0.3 | 13.7 | 49.0 | 15.7 |
| F&C Investment Trust | 0.1 | 12.2 | 57.0 | 13.4 |
| Bankers | -1.4 | 12.0 | 50.5 | 12.8 |
| Alliance Trust | -2.3 | 13.6 | 48.2 | 14.8 |
| JPMorgan Elect Managed Growth | -4.1 | 15.6 | 43.4 | 15.7 |
| Mid Wynd International | -5.7 | 15.1 | 68.7 | 12.9 |
| Witan | -8.2 | 13.6 | 26.9 | 15.2 |
| Lindsell Train | -10.5 | 13.4 | 87.7 | 12.6 |
| Martin Currie Global Portfolio* | -19.4 | 22.1 | N/A | N/A |
| Monks | -21.2 | 17.8 | 55.1 | 17.2 |
| Manchester & London | -29.3 | 26.4 | 20.1 | 20.6 |
| Keystone Positive Change** | -30.1 | 28.6 | N/A | N/A |
| Scottish Mortgage | -34.1 | 30.1 | 125.9 | 23.8 |
* Martin Currie Global Portfolio changed manager in June 2018.
** Keystone only became a global equity strategy in February 2021 after a change in mandate. Prior to that it was a UK equity strategy.
Source: Morningstar, as at 31/07/2022. Blue Planet is excluded due to its sub £6m asset size.
Past performance is not a reliable indicator of future results
Brunner (BUT) has also done well over the last 12 months, generating a positive NAV total return. This is not entirely unsurprising though, considering the BUT team’s strict valuation discipline, which has led the trust to avoid the strong growth biases that many of its peers have historically traded with. Instead, the team prefer BUT to be diversified across styles, regions and sectors. The BUT team also invest with a structural bias to the UK, which is a differentiator to its peers as well as a strong driving force behind its positive 12-month returns, given the region’s outperformance. Another factor behind BUT’s performance has been the team’s contrarian approach to investing, where they have typically purchased out-of-favour companies to capitalise on long-term mispricing.
Thanks to the losses over the past year, the closed-ended sector is now behind the open-ended sector over five years. We think this is a reminder that while gearing can lead to outperformance, investors have to be prepared for returns to look dicey in the aftermath of down markets. We note that if we were to turn back the clock to the end of 2021 the relative five-year performance would have shifted substantially, as then the IA and AIC sectors were neck and neck and respectively returning 76.8% and 76.3% in NAV terms. However, the best-performing strategy over that period was an investment trust, with Scottish Mortgage’s (SMT) 327.2% NAV return 40% ahead of the next-best strategy. Dial it back one year further, to the end of 2020, and the closed-ended sector had outperformed, returning 88.3% compared to the 86.4% of the open-ended sector.
Over the long term it has been growth strategies in both peer groups which have overwhelmingly dominated, given the phenomenal tailwinds the style saw between 2019 and 2021. If we solely focus on strategies which are categorised as global equity large-cap strategies by Morningstar (as both the IA and AIC sectors contain a number of highly specialised strategies), we find that Baillie Gifford also dominates the five-year performance rankings, given the investment manager’s ubiquitous focus on growth opportunities. The best-performing strategy over the last five years has been the open-ended fund Baillie Gifford Positive Change, which has returned c. 135%. We note that the Baillie Gifford Positive Change strategy now exists in a closed-ended fund, with the team having taken over management of the Keystone Positive Change (KPC) in February 2021. Coming in second place is the indomitable SMT, arguably the UK’s most famous growth-stock champion, and certainly the largest given its current £12bn in assets, which make it the third-largest strategy amongst our selection. As at 31/12/2021 SMT was by far the best-performing strategy in both sectors over five years, before the recent down market kicked in.
Our sample produced two investment trusts which outperformed the average returns of both the AIC Global sector and the IA Global sector over both a one- and five-year period, those being BUT and F&C Investment Trust (FCIT). BUT’s outperformance can be partially explained by its team’s previously mentioned strategy, which meant that the trust did not see as bad a drawdown as many of its peers in 2022. Its outperformance was also thanks to the positive effects of long-term stock selection, with the team having a history of picking outperforming stocks within their sectors or regions. While BUT has a concentrated portfolio of 65 stocks, FCIT has a far more diverse, multi-manager portfolio. Run by manager Paul Niven, FCIT utilises BMO’s own investment managers as well as select external managers. Each manager reflects a specific region or style of investing, with Paul actively stewarding FCIT’s allocation to each manager in accordance with his views on the prevailing market environment. For example, Paul had an overweight to US growth during 2020 and part of 2021, capitalising on the tailwinds behind the style during those periods. However, he has since trimmed this exposure in favour of more value-biased managers. It is active allocation decisions like these, in conjunction with the positive stock selection of his delegated managers, which have allowed FCIT to outperform in multiple cycles. Paul also makes use of private equity, which not only acts as a source of diversification, but also sets FCIT apart from its open-ended equivalent, as we point out later in this article.
Same time, different measures
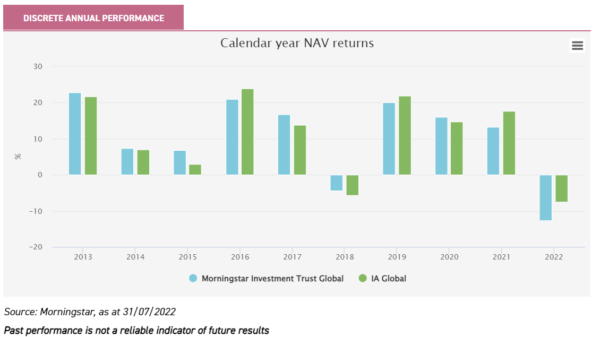
One question that remains is: why have open-ended strategies outperformed closed-ended strategies? We have referred to one obvious contributor to this already: in the AIC Global sector, the average investment trust utilises some form of gearing (be it structural or a revolving credit facility), with ten out of the 16 sampled investment trusts currently having a positive level of net gearing. Gearing is a double-edged sword, enhancing gains on the upside and losses on the downside. However, the use of gearing has been an overall net benefit to investors, at least during up markets. While the investment universes of both the IA and AIC sectors have evolved over time, it is the closed-ended universe that on average outperforms during periods of rising markets, as can be seen in the below chart.
But are there other reasons too? We note that investment trusts have displayed a far greater variation in their performance. If we again focus on the global equity large-cap strategies (as the specialist strategies can lead to warped volatility figures), we find that the AIC Global sector has a standard deviation of 13.4% between the performance of its respective strategies, compared to the 9.7% of the IA Global sector. One would think that substantial differences in investment styles might explain the variation, yet at a very high level the sectors are very comparable. Both have a clear tilt to growth (though both sectors would just about be considered ‘core’ styles by Morningstar) with similar levels of concentration and diversification, and both have a bias to small caps when compared to the MSCI ACWI. The average strategy in both peer groups also falls into the ‘average’ category for sustainability, representing a higher score than that of the MSCI ACWI.
Sector Characteristics
| AVERAGE MARKET CAP (MIL), GBP | NUMBER OF HOLDINGS | NUMBER OF STOCK HOLDINGS | % OF ASSETS IN TOP TEN HOLDINGS | VALUE-GROWTH SCORE | |
| AIC Global average | 70,987.2 | 114.1 | 92.5 | 43.1 | 193.0 |
| IA Global average | 58,891.4 | 121.2 | 106.3 | 38.3 | 194.9 |
| iShares MSCI ACWI ETF | 83,179.4 | 2,362 | 2,319 | 16.8 | 168.8 |
Source: Morningstar, as at 31/07/2022
A quarter of the closed-ended peer group are high-growth strategies which have seen substantial drawdowns over 2022. This includes the two most geared trusts, Martin Currie Global Portfolio (MNP) and SMT; both have 11% net gearing, and both also happen to have the highest growth-stock biases in the peer group. It is therefore no surprise that they are amongst the worst performers over the past 12 months, contributing to the lower average. However, we would argue that the aggressive style of investing that both trusts implement is a strong long-term strategy, and that investors should expect bad returns over short time periods as this is all part and parcel of being highly active.
MNP offers investors a highly concentrated, low-turnover approach to global quality-growth investing. It is underpinned by what its manager Zehrid Osmani believes are the most promising megatrends present within global economies, such as resource scarcity and demographic changes. Zehrid believes in turn that his companies should be able to demonstrate superior long-term growth trajectories, given the huge opportunities these megatrends represent. Due to the long-term growth potential such secular trends can command, investors of a similar mindset to Zehrid’s may find the trust’s gearing to be an attractive differentiator to its open-ended peer, given that it grants them a greater exposure to said trends. Yet thanks to the impact of gearing, MNP has also underperformed its open-ended equivalent.
Outside of the impact of gearing, investment trusts are also differentiated by their ability to hold more illiquid assets. Given the daily liquidity requirements of open-ended funds, they are not practical investments to be held in any worthwhile quantity in case they run the risk of becoming the next Woodford scandal. Yet there are substantial benefits to unlisted assets, as not only do they offer a different asset class, and thus diversification potential, but their periodic valuations also reduce NAV volatility.
KPC is the perfect example of how a closed-ended structure can differentiate itself for the better. It was taken over by Baillie Gifford in February 2021 and is now managed by Kate Fox and Lee Qian, who follow a very similar process to the Baillie Gifford Positive Change Fund, but with a few key differences. KPC has a greater focus on smaller companies, with the ability to invest in companies with a market capitalisation of $500m or greater, compared to a $1bn minimum market cap requirement for the open-ended fund. KPC can also invest up to 30% of its NAV in unlisted funds, though in practice this will likely be 5–10% of its NAV over the coming years. KPC also utilises structural gearing, which is currently worth 9% of NAV. KPC is defined by more than simply taking clear advantage of the trust structure to give its managers greater freedom in how they invest. Also important is its dual mandate of capital growth and the adoption of a comprehensive commitment to contributing towards a sustainable and inclusive world. The team’s positive impact is focussed around four key themes: 1) Social inclusion and education, 2) Environment and resource needs, 3) Healthcare and quality of life, and 4) ‘Base of the pyramid’.
One size does not fit all
The idea of ‘one-stop shop’ portfolios – well-diversified global portfolios which typically use a multi-manager approach – is not unique to the investment trust universe. However, it does arguably have some of the more unique strategies – and certainly the largest, as FCIT is the largest multi-manager portfolio within our sampled cohort. FCIT is also set apart by its investments into private equity funds. These strategies require lock-up periods, and thus are unsuitable for open-ended funds. FCIT manager Paul Niven believes his cohort of private equity strategies represent some of the best managers available to the market.
FCIT is not the only interesting ‘one-stop shop’ solution in the AIC sector. Alliance Trust (ATST) and Witan (WTAN) both have a unique approach to selecting their delegated managers. For example, WTAN combines bespoke accounts run by leading investment managers with specialist investment funds, pre-existing collective investments whose style falls out of the remit of mainstream fund managers. Rather than simply holding a portfolio of open-ended funds, WTAN’s executive team, led by Andrew Bell, ask managers to run portfolios of their best ideas. These portfolios each represent a clearly delineated investment style (though with an overall bias to high-quality companies) designed to ensure WTAN maximises its chances of generating alpha. ATST also takes a similarly differentiated approach, utilising unique portfolios of its delegated managers’ best ideas, as opposed to off-the-shelf collective funds. ATST leverages the expertise of Willis Towers Watson (WTW), one of the world’s largest investment consultants, to construct its portfolio of managers. WTW selects what it believes to be the world’s best investment managers, and its scale allows it to tap into professional investment managers that many retail investors would typically be unable to access. WTW then takes this 20-manager buy list and selects a cohort which it allocates in a manner that diversifies away any stylistic biases relative to the trust’s benchmark the MSCI ACWI. ATST currently has a cohort of eight managers across nine styles. This produces a potentially core allocation which aims to preserve the benefits of both active management and the closed-ended structure.
Trust a bargain
The sell-off of the last year has led to investment trusts trading on some considerable discounts, which we think could prove good entry points over the long run. As can be seen in the below table, not only does the average global equity investment trust trade on a discount, but many of them also trade with a negative one-year Z-score, indicating that their discount today is wider than its average level over the past 12 months.
Current Discount and Gearing Levels for the AIC Global Sector
| DISCOUNT / PREMIUM (%) | DISCOUNT ONE-YEAR Z-SCORE | NET GEARING (%) | |
| Alliance Trust | -5.5 | 0.7 | 5 |
| AVI Global | -9.8 | -0.7 | -3 |
| Bankers | -6.4 | -0.9 | 8 |
| Brunner | -10.2 | -0.1 | 6 |
| F&C Investment Trust | -5.6 | 2.0 | 4 |
| Global Opportunities Trust | -13.7 | -0.2 | -33 |
| JPMorgan Elect Managed Growth | -4.0 | -0.6 | -6 |
| Keystone Positive Change | -5.9 | 0.2 | 9 |
| Lindsell Train | 15.0 | 0.5 | -6 |
| Manchester & London | -15.5 | 0.3 | 0 |
| Martin Currie Global Portfolio | -0.6 | -0.1 | 11 |
| Mid Wynd International | 2.0 | 0.3 | 0 |
| Monks | -6.3 | -0.4 | 6 |
| Scottish Investment Trust | -1.5 | 1.1 | 5 |
| Scottish Mortgage | -1.6 | 0.1 | 11 |
| Witan | -6.1 | 1.0 | 9 |
Source: JPMorgan Cazenove, as at 11/08/2022, Blue Planet is excluded due to its sub £6m asset size
Conclusion
Being caught in a bear market is never a fun time for any investor, though investment trusts seem to be having the worst of it, in the global sector at least. This is not unexpected, due to the impact of gearing and the presence of several high-growth strategies. While the AIC Global and IA Global sectors appear similar on the surface given their comparable concentrations, average style biases and small-cap bias, investment trusts differentiate themselves in a number of different ways. Some of the multitude of ways in which investment trusts set themselves apart from their open-ended cousins are the use of gearing, the ability to use unlisted investments and their unique approaches to multi-manager investing. And, thanks to the attractive discounts many trusts trade on, they may in fact be the better option for investors looking to capitalise on an eventual recovery in global equities.

Disclaimer
This is not substantive investment research or a research recommendation, as it does not constitute substantive research or analysis. This material should be considered as general market commentary.
Commentary » Investment trusts Commentary » Investment trusts Latest » Latest » Mutual funds Commentary
Leave a Reply
You must be logged in to post a comment.