Jul
2026
The UK Equities Grandaddy ETF
DIY Investor
19 July 2026
The stellar track record of the S&P 500 is the foundation of modern investing. But what if index trackers had been invented in the UK in 1900? How would that look?
Almost a quarter of a century ago, Warren Buffett urged investors to put their money into index trackers. The Sage of Omaha said:
“Most investors, both institutional and individual, will find that the best way to own common stocks is through an index fund that charges minimal fees.”
Buffett’s dictum rests upon the empirical fact that the market is extremely hard to beat. Afterall, US stocks have returned an astounding 10 % annualised in dollar terms since 1900.
But what if the index fund had not been invented in 1970s America? What if the grandaddy of ETFs had first launched in Britain over 100 years ago? Would a UK equities ETF be a great advert for buy and hold investing?
The good news is that if your great-great grandparents could have invested in a UK index tracker back then, it would have compounded at a solid 8.77 % annualised.
And while the UK’s share of global indices has declined in recent years, the FTSE All-Share has actually outperformed the MSCI World since the latter’s launch: 11.05 % to 10.39 % (annualised returns, 1970-2025).
So to celebrate the UK’s status as a stock market investing powerhouse, we thought it would be fun to imagine a justETF webpage for a UK equities ETF launched at the dawn of the 20th century.
In so doing, we’re able to recreate the British investing experience over the past 126 years. At least in an alternative universe where you could send a telegram to your broker and place an order for shares in the new-fangled Exchange Traded Funds that were causing such a stir back in 1900…
The UK Equities Grandaddy ETF
Ticker: GDAD
Description: The UK Equities Grandaddy ETF tracks the largest and most traded British firms from 1900 to 2025. From 1962 to the present, it follows the FTSE All-Share index which covers 98 % of the London Stock Exchange by market capitalisation. Index: Composite UK stock index / FTSE All-Share
Investment focus: Equity, UK
Total expense ratio: Cheap at the price
Replication: Physical
Legal structure: ETF
Strategy risk: Long only
Fund currency: GBP
Currency risk: Currency unhedged
Inception: 1 January 1900
Distribution policy: Accumulating
Fund domicile: UK
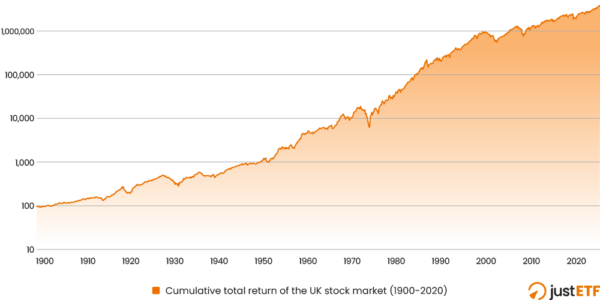
Returns overview of the UK Equities Grandaddy ETF
| Years | Cumulative total return | Annualised total return |
|---|---|---|
| 1 | 24.02 % | 24.02 % |
| 3 | 46.51 % | 13.58 % |
| 5 | 73.94 % | 11.71 % |
| 10 | 123.44 % | 8.37 % |
| 15 | 199.01 % | 7.58 % |
| 20 | 283.86 % | 6.96 % |
| 25 | 328.32 % | 5.99 % |
| 30 | 720.97 % | 7.27 % |
| 35 | 1685.98 % | 8.58 % |
| 40 | 3230.01 % | 9.16 % |
| 45 | 9871.11 % | 10.77 % |
| 50 | 24217.68 % | 11.61 % |
| 100 | 1026233.23 % | 9.68 % |
| 126 years (MAX) | 4001376.55 % | 8.77 % |
Total returns for every year 1900-2025 of the UK Equities Grandaddy ETF
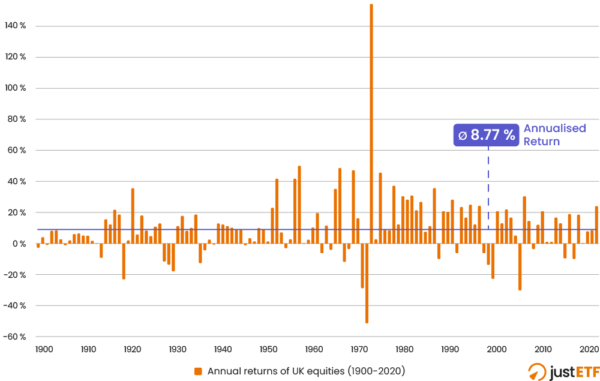
Best and worst annual returns of the UK Equities Grandaddy ETF
| Year | Best annual returns | Year | Worst annual returns |
|---|---|---|---|
| 1975 | 154.51 % | 1974 | -51.51 % |
| 1959 | 50.28 % | 2008 | -29.93 % |
| 1968 | 48.59 % | 1973 | -28.56 % |
| 1971 | 47.21 % | 2002 | -22.68 % |
| 1977 | 45.48 % | 1920 | -22.63 % |
| 1954 | 41.75 % | 1931 | -17.75 % |
| 1958 | 41.55 % | 1930 | -13.42 % |
| 1980 | 37.19 % | 2001 | -13.29 % |
| 1989 | 35.52 % | 1937 | -12.33 % |
| 1922 | 35.48 % | 1969 | -11.83 % |
Risk assessment of the UK Equities Grandaddy ETF
| Bear market start | Bear market end | Bear market duration | Max drawdown |
|---|---|---|---|
| 31/01/1920 | 31/10/1921 | 1y 9m | -31.08 % |
| 31/01/1929 | 30/06/1932 | 3y 5m | -45.27 % |
| 31/01/1937 | 31/07/1940 | 3y 6m | -25.57 % |
| 31/10/1951 | 30/06/1952 | 0y 8m | -21.33 % |
| 31/07/1957 | 28/02/1958 | 0y 7m | -20.14 % |
| 31/01/1969 | 31/05/1970 | 1y 4m | -30.00 % |
| 30/04/1972 | 30/11/1974 | 2y 7m | -66.36 % |
| 30/09/1987 | 30/11/1987 | 0y 2m | -33.60 % |
| 31/08/2000 | 31/01/2003 | 2y 5m | -42.92 % |
| 31/10/2007 | 28/02/2009 | 1y 4m | -41.09 % |
| 31/12/2019 | 31/03/2020 | 0y 3m | -25.13 % |
High water mark chart of the UK Equities Grandaddy ETF
UK stock market growth of the UK Equities Grandaddy ETF
Maximum: +4,001,376.55 %
Date: 31/12/2025, in % GBP
Cumulative total returns 1900-2025

Like all markets, the long-term growth of UK equities has been punctuated by periodic and, at times, severe drawdowns.
Drawdowns occur when a market falls below its previous peak, and end when a new high is reached. The length and depth of each drawdown is shaded in purple.
Risk overview of the UK Equities Grandaddy ETF
| Years | Volatility | Return per risk |
|---|---|---|
| 1 | 7.62 % | 3.15 |
| 3 | 9.00 % | 1.508 |
| 5 | 9.67 % | 1.21 |
| 10 | 11.83 % | 0.708 |
| 15 | 11.59 % | 0.654 |
| 20 | 13.01 % | 0.535 |
| 25 | 13.32 % | 0.45 |
| 30 | 13.33 % | 0.545 |
| 35 | 13.47 % | 0.637 |
| 40 | 14.71 % | 0.623 |
| 45 | 14.76 % | 0.729 |
| 50 | 15.33 % | 0.758 |
| 100 | 15.70 % | 0.616 |
| 126 years (MAX) | 14.29 % | 0.614 |
Rolling 1 year volatility

Further information (as of 31/12/2025)
- Annualised return: 8.77 %
- Cumulative return: 4,001,376.55 %
- Volatility: 14.29 %
- Return per risk: 0.61
- Max drawdown: -66.36 % (November 1974)
- Longest drawdown: 7 years (January 1929 – January 1936)
Here you can find more on investing in the UK using ETFs.
Sources:
1900-1929 UK stock returns, Campbell G, Grossman R, Turner JD. (2021): Before the cult of equity: the British stock market, 1829–1929. European Review of Economic History. 25. 10.1093/ereh/heab003.
1930-1962 Composite UK stock index, Chadha J, Rincon-Aznar A, Srinivasan S, Thomas R. A Century of UK Economic Trends. ESCoE, NIESR and Bank of England.
1962-2018 FTSE All-Share index, A Century of UK Economic Trends.
2018-2025 FTSE All-Share index, FTSE Russell.

Alternative investments Commentary » Brokers Commentary » Commentary » Exchange traded products Latest » Latest
Leave a Reply
You must be logged in to post a comment.