Nov
2022
The stability dividend
DIY Investor
5 November 2022
Our analysis shows that trusts paying a regular income suffer less discount volatility…by Ryan Lightfoot-Aminoff
Investment trust boards have a number of levers they can pull to increase demand for their shares and try to ensure share prices remain close to NAV. One key attraction for investors is the dividend. As such, we regularly see boards increase dividends, change payout policies or make numerous other changes to how and when dividends are paid, with the implicit (or sometimes explicit) aim of narrowing the discount. We decided to test one thesis that has been put to us: do trusts with more frequent dividends achieve narrower discounts?
This has implications from a number of perspectives. A board may ask if a discount might be kept narrower if the trust pays dividends twice a year rather than once, or four times rather than twice. From an investor’s perspective, the question is reversed to: can I reduce the risk of a widening in the discount to NAV that my shares are trading on by buying a trust which pays out dividends more frequently? We think this might be a particularly attractive feature for those making regular investments, and we decided to put it to the test.
Methodology
In order to test this hypothesis, we compiled a list of all investment trusts that feature in one of the AIC’s equity sectors, aiming to cover all geographies, including single countries and globally focussed trusts. This list was then filtered to include only those yielding over 2% to ensure that income was likely to be a key feature of the investment case. Within this universe we analysed five years of month-end discounts or premiums for each trust, calculating an average and standard deviation of the discount over the period for each. These were then compared against the number of dividends that were paid by each trust in each year, either annually, semi-annually or quarterly.
Results
Five-year cumulative results
| DIVIDEND FREQUENCY | AVERAGE DISCOUNT (%) | AVERAGE STANDARD DEVIATION OF DISCOUNT |
| Annual | 1.3 | 6.5 |
| Semi-annual | 7.4 | 4.4 |
| Quarterly | 6.0 | 3.2 |
Source: Morningstar
This table demonstrates that over the five years, there is limited evidence to show that trusts that pay more dividends in the year have narrower discounts than those with fewer dividends. The average discount for those paying dividends annually is actually lower than that of those with more frequent dividends, and in fact those paying semi-annual dividends exhibited the widest average discount, although quarterly payers exhibited a slightly narrower average discount to them.
However, where we found a trend was in the standard deviation of the discounts. The five-year period from October 2017 to October 2022 was a period of particularly diverse market conditions that has culminated in a considerable down market in 2022, meaning the majority of the trusts in the sample have ended the period on a discount. The standard deviation figures are therefore a demonstration of the ‘stability’ of a trust’s discount throughout this period and reflect whether this moved around or was less volatile and more consistent.
The data in our study has demonstrated a link between the stability of the discount and the frequency of the dividends. As the number of dividends increased from annual to semi-annual and quarterly, the average standard deviation of the discount has fallen, demonstrating more stability in the discount for those trusts which pay dividends more regularly.
In order to test this in more detail, we explored the trend further by analysing the data in discrete years. We have therefore looked back from the time of writing through five discrete years to October 2017. Looking at these discrete periods of time allows us to compare equally long time periods, some of which cover some exceptional market conditions.
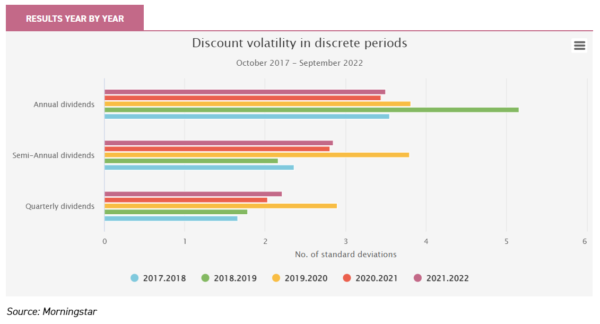
This data demonstrates the same type of results for each time period because again the stability of the discount as measured by the average standard deviation comes down as the frequency of dividends increases. This trend has occurred in each yearly time period spanning a number of very different market conditions, so in our view this demonstrates the validity of our thesis that trusts with more frequent dividend policies exhibit less volatile discounts.
Some of this can be attributed to the methodology used to identify the data set, as the method of removing the lowest yielders from the population has meant that the number of annually paying trusts was a smaller sample than for the other frequencies of dividend payments, and a smaller data set can lead to more skewed results. However, in our view, the consistency of the results cumulatively and over each time period is still a telling insight.
What is also of interest is that there are periods within the five years containing notable market sell-offs, such as Q4 2018, March 2020 and February 2022 to date. During such sell-off periods a smaller difference can be seen between the discount stability of the trusts which make the fewest dividend payments and that of those which make the most.
For the discrete period of October 2017 to the end of September 2018, when markets were relatively stable, there was a 53% difference in the discount volatility between annual and quarterly dividend-payers. In the 2019–2020 period, which featured the March 2020 Covid crash, this figure fell to a 24% difference. This reinforces the notion that in periods of market stress, many assets will sell off together. However, our evidence suggests that whilst market stress affects everything, a more frequent dividend may provide some defensiveness.
Discount variation in years
| 2017-2018 | ||
| Dividend frequency | Average standard deviation | Standard deviation variation |
| Annual | 3.6 | 0 |
| Semi-annual | 2.4 | -33.6% |
| Quarterly | 1.7 | -53.3% |
| 2019-2020 | ||
| Dividend frequency | Average standard deviation | Standard deviation variation |
| Annual | 3.8 | 0 |
| Semi-annual | 3.8 | -0.2% |
| Quarterly | 2.9 | -23.9% |
Source: Morningstar
Implications for investors
For certain investors, these insights could have some useful implications because a more stable discount would help those who save regularly. One of the main benefits of regular investing is that it helps smooth out market fluctuations. If the results of our study hold, then investors can be further assured that investing in those trusts with more frequent dividends will add to this stability as they are likely to be investing into trusts with less variability in their discounts.
This works too for those looking to sell down their investments, for example those in drawdown, especially in a down market. If investors can be reassured that discounts are more stable in trusts with certain characteristics, then these insights could again prove advantageous. Knowing a premium or discount is more or less stable may help mitigate some of the behavioural aspects of trying to time cash out of investments, especially in a volatile market like the one we have seen in 2022 so far.
One further consideration could be relevant for those investors who are more active and look to take advantage of anomalous discount opportunities. In periods of market stress, our data has shown that trusts with more frequent dividends demonstrated more stable discounts. Therefore, there could be an argument made that trusts that pay quarterly dividends but which have fallen sharply and trade on a wide discount relative to their historical average are statistically less likely to stay at that level for a prolonged period. This may therefore prove a compelling entry point for long-term investors.
Trust examples
There are a number of trusts which have quarterly dividends and offer strategies looking for increased stability or are trading on compelling discounts.
JPMorgan Asia Growth & Income (JAGI) aims to offer exposure to the best long-term growth prospects in Asia with both a growth and income objective. The managers supplement the income the trust generates from its underlying portfolio to pay out 1% of NAV each quarter. As a result of this, they are free to invest the portfolio in the best growth opportunities they can identify in the region whilst supporting total returns to investors. This offers investors Asian exposure, but within a risk-controlled framework which may prove attractive for many investors. The trust started 2022 trading close to NAV, but the discount has steadily widened throughout the year to around 10%, which could be seen as an opportune entry point.
Murray International (MYI) is one of the highest pure dividend-payers in the global equity income sector. The trust has maintained or grown its dividend for over 15 consecutive years and the managers also hold some in reserve should the dividend outlook weaken. The managers are able to do this through the trust’s flexible investing mandate which allows them to invest in a range of global equities as well as some bond holdings, should they prove attractive. This flexibility is used by the managers to generate a high and growing dividend. MYI has had a good year of performance on both a relative and absolute basis, generating a 6.7% return in 2022 to date (25/10/2022) as its investment approach has become more in favour. Despite this, the trust is still trading on a discount to NAV of 7.3%.
Troy Income & Growth (TIGT) has a more conservative approach to investing. The managers aim to generate both capital and dividend growth and work the trust as a buy-and-hold, long-term savings vehicle. This approach has led to a very stable discount, and these characteristics are positives for those looking to invest regularly, due to the lower volatility of the trust’s discount. The trust also pays dividends quarterly. The board has recently decided to rebase the dividend for the long-term benefit of investors, which has allowed the managers to better preserve capital in case of market turmoil, and to grow the trust’s NAV too. The trust yields a modest c. 3% on the current price, which provides a good tailwind to the investment case.
There have been a few changes in dividend policies among investment trusts in recent years which we show below. . One of these was the board of Law Debenture (LWDB), who moved the trust from paying a semi-annual to a quarterly dividend in June 2020. Looking back over a ten-year period, the trust’s discount had a standard deviation of 5.2 up to the period when the frequency of its dividend payment was changed. Since then, the standard deviation has reduced to 3.3. This again demonstrates the same pattern as the aggregate data: a reduction in discount volatility as a result of more frequent dividend payments. Whilst there have been many factors at play in these periods which would have affected the volatility of the discount, it is interesting to see one recent example of this play out in practice.
Whilst only a few, there are a number of other trusts that have changed their dividend policy in the past few years. This is not to say that we believe they will instantly see a market reaction, but they are certainly trusts to keep an eye on to see whether this theory plays out going forward.
Trusts which have changed dividend frequency in recent years
| TRUST | DIVIDEND FREQUENCY | LAST CHANGE |
| abrdn Asia Focus | Quarterly | Changed from annually in 2021 |
| Hansa Investment Company | Quarterly | Changed from semi-annually in 2019 |
| Henderson Opportunities | Quarterly | Changed from semi-annually in 2020 |
| JPMorgan China Growth & Income | Quarterly | Changed from annually in 2020 |
| JPMorgan European Growth & Income | Quarterly | Changed from semi-annually in 2022 |
| Law Debenture | Quarterly | Changed from semi-annually in 2020 |
| Montanaro UK Smaller Companies | Quarterly | Changed from annually in 2018 |
Source: AIC
Conclusion
Dividends are one of the primary attractions for supporters of investment trusts, so knowing they may assist in other ways is a welcome bonus. Our evidence hasn’t shown that trusts with more frequent dividend payments will benefit from narrower discounts; however, there is evidence to show they exhibit more stable discounts. This is useful for investors who value stability, such as regular investors and those who may be looking to draw down on their capital. Furthermore, more active investors who look for market inefficiencies may use this information to support a potential entry point for a long-term investment in the event of a sharp sell-off causing discounts to widen on trusts. When market conditions return to normal, it might be hoped that the previous pattern of a more stable discount will emerge, potentially providing a tailwind to share price returns.

Disclaimer
This is not substantive investment research or a research recommendation, as it does not constitute substantive research or analysis. This material should be considered as general market commentary.
Leave a Reply
You must be logged in to post a comment.