Dec
2020
The haves and have nots
DIY Investor
30 December 2020
This is not substantive investment research or a research recommendation, as it does not constitute substantive research or analysis. This material should be considered as general market commentary.
 With listed private equity trust discounts widening, are investors mistakenly assuming that underlying portfolios will perform worse than public market indices?…
2020 has not exactly been ‘topping’. Following a K-shaped recovery from COVID-19, the divergence between the haves and have nots has been stark.
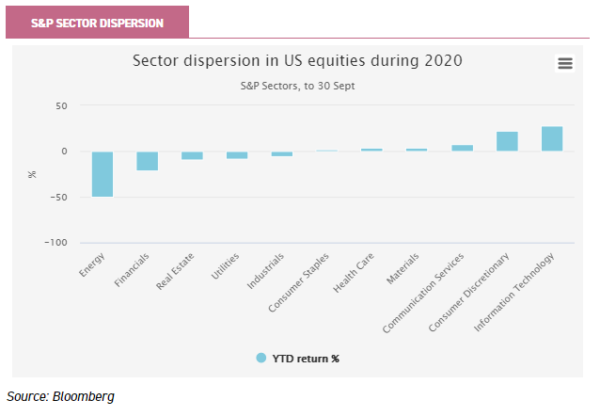
This trend is reflected in the graph below, which illustrates how dramatic the impact of COVID-19 has been on swathes of the equity market. The positive effect on consumer staples and technology has been almost as shocking as the negative impact COVID has had on the energy and financials sectors. The dispersion in returns has been staggering, with the difference between the energy and technology sectors being 78% in the first three quarters of 2020.
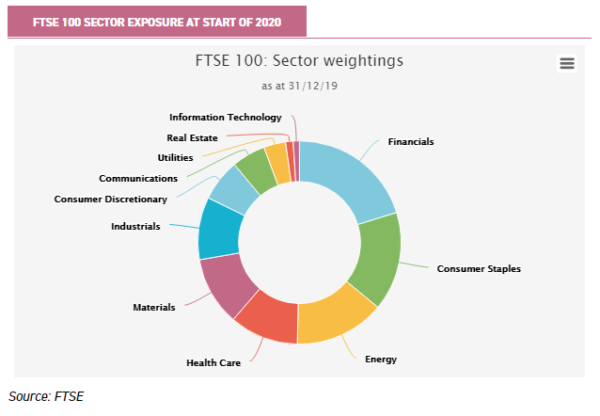
For UK investors who invest passively, 2020 has been painful. The UK equity market is dominated by the FTSE 100, an index which is itself dominated by financials, consumer staples and energy sectors: they constituted just over 50% of the FTSE 100 by market capitalisation at the start of the year.
Overall the FTSE 100 is down 22.9% (to 30 Sept), illustrating the preponderance of COVID-19 ‘losers’ within the UK index. By comparison the S&P 500 has delivered local currency returns of +3.3%, which perhaps illustrates the preponderance of ‘winners’ in that index.
For UK investors returns on the S&P will have been boosted by the relative strength of the dollar (+ 3% relative to GBP YTD), making the performance differential even starker.
For UK investors, therefore, supporting the ‘home team’ has cost them dear this year. Unwitting passive investors in the UK market have been too exposed to the UK’s COVID-19 losers. In fact, their sector exposure could hardly have been worse. The FTSE All-Share has been sadly stuck in the ‘loser’ camp.
Winners and losers
As we discussed last week, market capitalisation weighted indices aren’t necessarily the best way to allocate capital. Generally they reflect and weigh past successes. However, in this year more than many other years, actively managed portfolios will have experienced very different outcomes.
Depending on their exposure, some investors are likely to have been very happy with stock market returns this year, whilst others will have their head in their hands (sound like anyone you know, Pascal?).
Back in March everything looked pretty bleak. In the investment trust sector, discounts widened across the board. However the six months following the initial shock has seen some sectors recover dramatically.
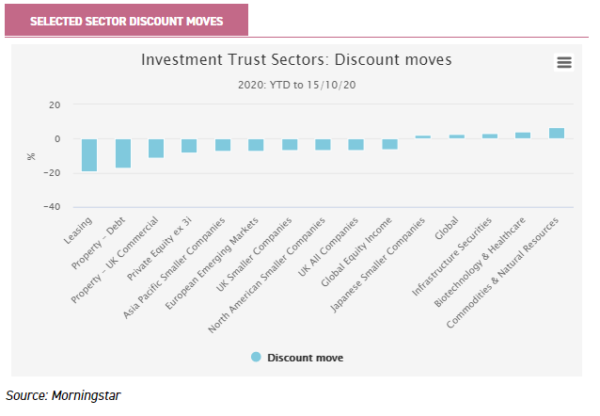
Others, however, remain significantly wider – in terms of discount – than they stood at the beginning of the year. Here, again, there are significant winners and losers.
Commodities trusts, for example, have seen average discounts narrow significantly, as their relative income attractions come to the fore and with metals prices largely remaining firm: in stark contrast to the oil price.
On the other hand, illiquid asset classes with opaque underlying exposures have seen discounts widen dramatically. In some cases these may be justified, given the decline in credit quality generally (leasing) and in property where it is not clear where valuations might end up – especially with a hard Brexit.
Next worst, in terms of discounts widening, in the graph below stands listed private equity. Yes, these assets are illiquid but their portfolios are much more dynamic: they offer exposure to the equity in companies, rather than a stodgy asset like a property, they are diversified and potentially offer greater returns than the likes of property or leasing.
And yet, since the beginning of the year listed private equity trusts are nearly 11% cheaper in discount terms, compared to global trusts which have seen their discounts narrow YTD.
Liverpool vs Accrington Stanley?
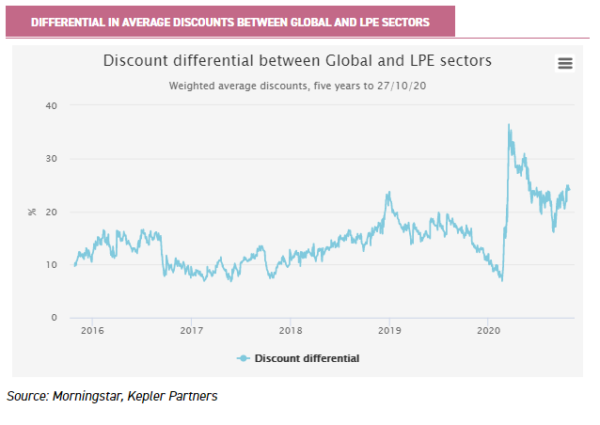
The graph below illustrates the discount move in the context of the past five years. Relative discounts were wider still in years prior to this, but reached a narrow point at the start of 2020. Despite having recovered much of the ground lost in the COVID crisis, average discounts in the LPE sector are now at 20% – which is 2.2% wider than the five year average (17.8%).
The disparity is as wide as it has ever been compared to global trusts, as we show in the graph below. Now that valuations are looking stable, in relative terms, it would appear on a discount basis to be as good a time as any in the past five years – barring a significant fall in portfolio valuations – to look at listed private equity trusts.
Disparity (…continued)
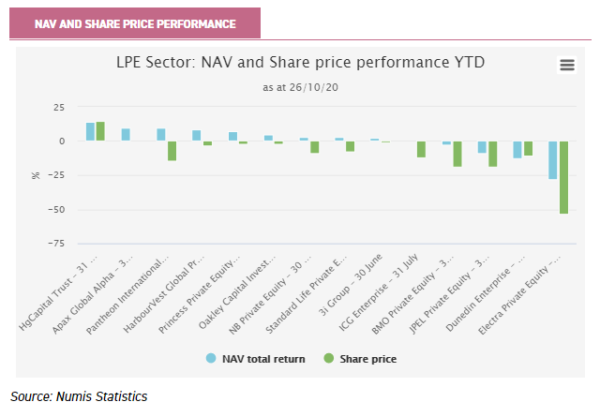
Reflecting the theme for this year, the LPE sector has shown a wide dispersion of returns in both NAV and share price terms – as we illustrate in the graph below. We think it is noteworthy that the worst performing in NAV and share price terms are those trusts that are in wind-up.
However, we believe that the significant derating of BMO Private Equity Trust and Pantheon International experienced this year, which have seen their discounts widen considerably, is particularly of note. We hope to initiate coverage on BMO Private Equity when it publishes its 30 September NAV towards the end of November. Please click here to be alerted when we do.
Both trusts saw their discounts narrow over 2019, so much so that they traded at a significant premium to the sector average. The market sell-off saw shares fall more than peers, and they are now trading closer to the peer group average discount.
Sceptics, to our view that the LPE sector offers value, will point out that valuations are not up to date, and that potentially there are ‘nasties lurking’.
Private equity funds typically only provide full valuations at 31 Dec and 30 June every year, with other valuations only reflecting FX movements and actual realisations.
Most NAVs in the LPE sector have so far been reported as at 30 June: although for some fund of funds, the lags involved in underlying funds reporting means that for a proportion of the portfolio the NAV, as at that date, will reflect even older data.
The end result is that it is often very hard to compare like with like. In the graph above most funds only reflect valuations that are at 30 June at best, despite several trusts having announced NAVs at a more recent date.
In public markets Q3 this year was relatively quiet, by comparison to the previous two quarters. The UK was modestly down, Europe was flat and the US continued its rise.
As a result, aside from specific operational performance from portfolio companies, one might expect relatively little movement since 30 June within private equity portfolios. Currencies will have had a small effect, with USD having depreciated by 4.9% vs GBP since 30 June ($1.29 as at time of writing) and the Euro by c. 1% over the same period (€1.1 at time of writing).
However Blackstone, who revalue their private equity investments quarterly, reported Q3 returns of 12.2% based on 11 funds with aggregate value of $44.2bn. KKR, Apollo and Carlyle reported increased valuations for their buyout funds of 16%, 8%, and 5% respectively as at 30/09/20.
Perhaps the data from these US private equity titans suggests that our expectations for LPE trusts are conservative? As we note above most full valuations on portfolios will next be performed as at 31 December, and therefore only factored into NAV announcements during Q1 2021.
Resilience
Depending on the COVID situation we find ourselves in then, a decent NAV performance in the second half of the year from the LPE sector could lead to more confidence in portfolios and spur a re-rating from the wide discounts we currently see.
In our view, much will be determined by the extent to which these portfolios were exposed to companies in the COVID ‘winners’ camp. Clearly every business has been presented with challenges, but we believe that those with private equity backers are likely to be in a better position than their competitors.
Certainly private equity tends to use gearing more extensively, but company management are typically more nimble, motivated and also have a ‘back-up’ to lean on in the form of the private equity manager.
In most cases both of these sets of management are used to having to deal with rapid change, and are well set up to evaluate new circumstances and adapt so that businesses can continue to grow.
The long-term nature of private equity funds means that they are typically not afraid to take hard short-term decisions, if it is in the long-term interests of a business.
In many cases financing structures are now more balanced in favour of equity owners than they had been in the past, with fewer covenants now than in the Global Financial Crisis (GFC) and lower borrowing costs.
No bear traps?
Anecdotally many of the trusts we cover appear to have portfolios that have, by luck or judgement, an element of COVID resilience baked in. JPMorgan recently published a list of those areas which have been worst affected by COVID.
In order of worst performance to least bad, they included financials (both banks and insurance), EM ex Asia, Large Cap European stocks (filled with the ‘wrong’ sectors), cyclicals (mining, steel, construction, etc), consumer cyclicals (airlines), dividend stocks (aka value), Japanese stocks, energy, telecoms and real estate.
Within the LPE portfolios we have looked at, there seems to be little overlap. On the surface, therefore, it would appear that LPE trusts are less exposed to the potential ‘bear traps’ that public market investors will find themselves having stumbled into.
HgCapital Trust
From the ground up the onset of COVID-19 has reportedly brought consumers’ online habits forward, by as much as four years. It is therefore perhaps not surprising that the companies which are exposed to this structural growth trend have done very well indeed during lockdown.
This is, in our view, undoubtedly the reason that HgCapital Trust (HGT) has been performing so well and why, with a narrow sector focus on software and business services, it has the rare distinction of trading on a premium to NAV (2% as at 28/10/2020).
We understand that, if aggregated together, HGT’s portfolio companies would be the third-largest software business in Europe. HGT’s focus means that it is in the right place at the right time, but it does present risks.
HGT provides exposure to high-growth niches, which are found in few places in publicly listed businesses, but the premium rating to NAV leaves it vulnerable to sentiment. We expect the updated 30 September NAV to be announced in November.
Oakley Capital Investments
Many of the same dynamics have benefitted the underlying portfolio of Oakley Capital Investments (OCI), which focusses on the technology, education and consumer sectors.
As we discuss in this flash update, OCI has delivered sector leading returns over the past three years and, assuming the current trends continue, seems well placed to continue to deliver strong returns in the COVID era.
Oakley typically likes to invest in businesses which are founder-led and, more importantly, have an element of technology that enables them to deliver their product or service digitally, ideally with a subscription element.
When the managers updated investors after the interim results – accessible here – the team stated that 12 out of their 15 companies are forecast to meet or beat their budget for 2020, or have returned to budgeted run rates in H2. In our view this result sounds like more COVID winners than losers.
Of more relevance to short-term NAV prospects, we understand that four of the five companies that outperformed their budgets in the first half of 2020 (WebPros, Ocean Technologies Group, Seven Miles and Contabo – together representing 15% of NAV) were all acquired in the last 12 months.
Oakley’s policy is that its valuations remain at cost for the first 12 months, potentially suggesting that their performance has not been reflected in the NAV at this stage.
To any extent that the reassuring trends referred to by OCI’s manager continue, we might expect further NAV progress to be reported at the end of January.
We also note that CPG (8.8% of NAV) is the other company with uninterrupted trading. It was revalued upwards at the end of June 2020 but, given how significant it is in terms of the overall portfolio, its subsequent performance will also likely have a strong influence on NAV returns.
We see the next NAV update, due to be published in late January and which will show data as at 31 December 2020, as a key catalyst for investors to watch for – in terms of prompting the discount to narrow.
OCI is well placed in our view, with significant cash on the balance sheet, but seemingly remains underappreciated by investors, as indicated by the current 28% discount.
NB Private Equity Partners
NB Private Equity Partners (NBPE) held a capital markets day recently – the full presentation of which is available here – which gave investors an update on the directly invested portfolio, constituting 84 companies.
What was apparent to us from this presentation was that the underlying businesses in the portfolio have largely been resilient, with few companies giving particular cause for concern.
Part of the reason for this resilience was that, for quite some time, the managers have recognised that equity markets had experienced an extended strong run.
They invest solely through co-investments, and so the managers had been selecting investments positioned for the latter stages of the economic cycle; resulting in a skew to sectors such as tech, media & telecom, and healthcare, which have generally proved resilient this year.
Even within sectors where one might expect potential issues, the types of companies that NBPE owns have actually proved resilient.
A good example is consumer (20% of the directly invested portfolio), where performance has been driven by two very strong performers: Action (the European discount retailer) and PetSmart/Chewy (the US pet supplies retailer).
Overall, the top five consumer businesses have seen their EBITDA rise by 16.8% over the 12 months to 30 June 2020. Financial services have also been more resilient than one might expect from a purely sectoral standpoint.
However, NBPE has positioned this portion of the portfolio in less cyclical companies, such as insurance brokerage, financial consulting, an independent broker dealer and a credit bureau – as represented by the top five companies.
This sector represents 9% of the direct investment portfolio by value. Combined, they have seen their EBITDA over the 12 months to the end of June 2020 grow by 6.9%.
The only sector which has shown negative EBITDA growth over the 12 months to the end of June 2020 among the top five companies is business services, representing 11% of the direct investment portfolio and in total constituting nine companies.
Overall the lockdown has had a negative effect on these companies, with EBITDA down 9.6% among the top five companies over the 12 months to June 2020.
One advantage of co-investing is that the managers have very granular details on the performance of the underlying investments.
Quarterly financial statements are typically issued two months after the quarter end, which means that the next full NAV calculation for NBPE will be announced in December 2020: although not necessarily including any exits made after 30 September.
This year’s sell-off has hit NBPE’s share price more than most, and it currently trades on a discount of 27%. In our view this is an opportunity for long-term investors who want exposure to the excellent returns potentially available from private equity, but who also stand to benefit if the discount to NAV narrows. As a result this may represent an attractive entry point, particularly if the board finds itself in a position to resume buybacks.
ICG Enterprise
ICG Enterprise (ICGT) offers a hybrid approach to private equity investing: with around 56% of the portfolio through third party funds and 44% within the ‘high-conviction’ portfolio, where the managers have selected the underlying companies directly through co-investments and through ICG funds.
Within the high-conviction portfolio, which represents 79% of the top 30 investments, we understand the managers have been picking companies which exhibit defensive growth.
At the same time their third party fund selection has been centred around more experienced, longer-established private equity managers who invest in larger, more resilient buyouts.
Building a portfolio of companies that should weather economic cycles well has clearly put the trust in a good position in the current environment. The company announced its interim results (to 31/07/2020) in October.
Over the six months the NAV total return was -1.0% (largely reflecting valuation moves over the six months to 30 June) and was ahead of the FTSE All-Share, which returned -17.8% over the same period.
A key contributor to this outperformance has been the high exposure to sectors more resilient to COVID-19 pressures, including healthcare/education, consumer staples, business services and technology (together accounting for c. 70% of the portfolio).
In our view this range highlights how companies in ICGT’s portfolio are exposed to very different markets and growth drivers, than those in public markets.
It remains to be seen how the portfolio, as a whole, progresses over the rest of the year. For much of 2019 the discount remained narrower than 20% but ICGT currently trades at a 25.5% discount, which looks good value from our perspective.
Conclusion
Both anecdotally and in the evidence provided so far, in terms of valuations and earnings, the listed private equity trusts we cover seem to have been more exposed to COVID winners than losers. As a result, portfolios appear to be resilient.
As the dust from COVID settles, companies’ operational performance over this period will start to get better reflected in portfolio valuations. In our opinion this looks like it will show that the majority have dealt with challenges well, and, on a relative basis, will have outperformed public markets.
With more evidence of this resilience coming through, and with discounts still remaining significantly wider than they started the year, the attractions of the sector are sparking. In hindsight we believe LPE trusts will have proved themselves toughs, rather than wilting toffs.
Click to visit:

Past performance is not a reliable indicator of future results. The value of investments can fall as well as rise and you may get back less than you invested when you decide to sell your investments. It is strongly recommended that Independent financial advice should be taken before entering into any financial transaction.
The information provided on this website is not intended for distribution to, or use by, any person or entity in any jurisdiction or country where such distribution or use would be contrary to law or regulation or which would subject Kepler Partners LLP to any registration requirement within such jurisdiction or country. In particular, this website is exclusively for non-US Persons. Persons who access this information are required to inform themselves and to comply with any such restrictions.
The information contained in this website is not intended to constitute, and should not be construed as, investment advice. No representation or warranty, express or implied, is given by any person as to the accuracy or completeness of the information and no responsibility or liability is accepted for the accuracy or sufficiency of any of the information, for any errors, omissions or misstatements, negligent or otherwise. Any views and opinions, whilst given in good faith, are subject to change without notice.
This is not an official confirmation of terms and is not a recommendation, offer or solicitation to buy or sell or take any action in relation to any investment mentioned herein. Any prices or quotations contained herein are indicative only.
Kepler Partners LLP (including its partners, employees and representatives) or a connected person may have positions in or options on the securities detailed in this report, and may buy, sell or offer to purchase or sell such securities from time to time, but will at all times be subject to restrictions imposed by the firm’s internal rules. A copy of the firm’s Conflict of Interest policy is available on request.
Commentary » Investment trusts Commentary » Investment trusts Latest » Latest » Mutual funds Commentary
Leave a Reply
You must be logged in to post a comment.