Apr
2024
Tall poppies
DIY Investor
6 April 2024
We highlight those trusts having to print new shares to keep up with demand…by Thomas McMahon
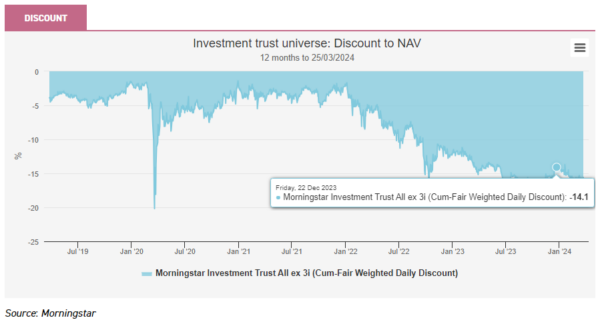
Easter is a time for optimism, and there are plenty of signs of new life to be seen in the investment trust sector, if you know where to look. It is true though that in the first three months of 2024, discounts have widened slightly on the investment trust sector, as the below chart shows. This follows a decent bounce in Q4, as the market became convinced the peak of the US interest rate cycle was in.
However, as the below chart shows, this has been down largely to the strength of NAVs reported rather than weakness in the share prices. Share prices have overall simply not quite kept up with underlying markets.
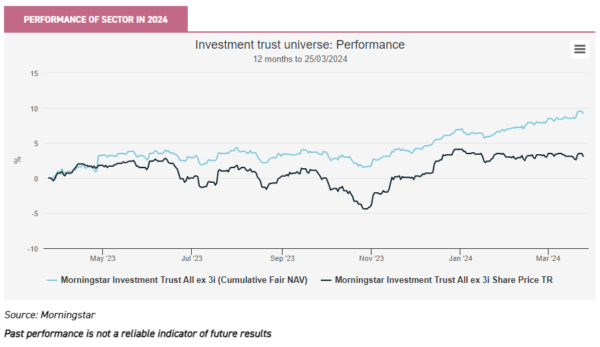
The classic example of this is the Technology sector, which has seen an average NAV total return of 8.5% while the shares have delivered just 3.8% (to 25/03/2024). We have highlighted the sector as a discount opportunity in recent weeks. But this is a phenomenon seen across major equity sectors: the UK, Europe, Japan, as well as the Global sector, have all seen good NAV gains and share price gains which, while positive, have not kept up.
In the alternative asset space, the picture has been less positive. While positive NAV total returns have been delivered so far across the Renewable, Infrastructure and Property sectors, share prices have sold off, in some cases significantly. This has been contributed to by some poor individual stock situations. For example, the battery storage funds reported poor news on their dividends and the share prices dived. However, even the highest quality trusts have seen their discounts widen. We think this is likely due to interest rate volatility: the number of rate cuts expected in the US by the market has declined since the start of the year and so yielding assets have repriced. There may have also been some contagion from the issues in the battery trusts and Digital Infrastructure.
NAV and SP moves of selected sectors
| SECTOR | NAV TR (%) | SHARE PRICE TR (%) | DIFF (%) |
| Morningstar Investment Trust Renewable Energy Infrastructure | 1.1 | -16.9 | 18.1 |
| Morningstar Investment Trust Royalties | 0.2 | -15.0 | 15.2 |
| Morningstar Investment Trust Property – UK Commercial | 1.3 | -9.2 | 10.5 |
| Morningstar Investment Trust Infrastructure | 0.7 | -7.6 | 8.3 |
| Morningstar Investment Trust Property – Europe | 0.0 | -5.7 | 5.7 |
| Morningstar Investment Trust Property – UK Healthcare | 1.4 | -4.2 | 5.5 |
| Morningstar Investment Trust Property – UK Residential | 1.2 | -3.6 | 4.8 |
| Morningstar Investment Trust Technology & Technology Innovation | 8.5 | 3.8 | 4.7 |
| Morningstar Investment Trust Leasing | 2.4 | -2.1 | 4.5 |
| Morningstar Investment Trust UK All Companies | 2.4 | 0.1 | 2.2 |
| Morningstar Investment Trust Global | 9.0 | 7.3 | 1.8 |
| Morningstar Investment Trust Japan | 9.2 | 7.8 | 1.4 |
| Morningstar Investment Trust Europe | 8.2 | 6.8 | 1.4 |
Source: Morningstar, as at 25/03/2024
Past performance is not a reliable indicator of future results
Why are discounts sticky?
We think share prices have probably lagged because of technical reasons rather than sentiment towards asset classes on their own fundamentals. In the short term, investors who want to get back into the market can easily buy ETFs or other passive vehicles, and delay any stock selection decision. Furthermore, the retail and wealth management investors who purchase investment trusts are likely slower to put money to work than traders and institutional investors. Aside from anything else, when you are earning 5% on cash, you are liable to be a little less energetic in your buys. In this light, we would expect discounts to narrow as optimism about the path of markets firms, and so we think it looks increasingly attractive to take on risk via the investment trust sector.
For example, the tech sector is still trading on a 10.3% discount to NAV. This seems like a decent discount to lessen the pain of buying into a market that is not cheap. UK and European equities are also available on c. 10% discounts, while even the Japan sector is on an average discount of 10.4%. This is despite Japan being probably only the second hottest story next to AI this year. As a ‘soft landing’ looks increasingly likely in the major global economies this year, the risk/reward outlook for equities is improving, and good performance from the major markets to start the year reflects this.
That’s the optimistic view. There are concerns, though, about longer-term trends and whether they imply discounts will never close. Specifically, the decline in the footprint of wealth managers in the investment trust sector may well be having an impact: as consolidation proceeds, more and more WMs are operating from centralised buy lists that require large funds and/or with propositions that exclude investment trusts as a whole. The high costs that have to be reported on KIDs have also been deterring many large investors who have to report these as part of their look-through costs to their investors. This second issue is being addressed by the regulator, and there is scope for positive change in the months to come. The first trend looks more entrenched.
Additionally, on the negative, higher rates available on bonds will have led to asset allocations shifting and this means there may well be excess capacity in the investment trust sector that will need to come out via buybacks, liquidation or consolidation. A lot of this has already happened, but there may be more to come. We speculate that this may explain why tech discounts are wide: a lot of the demand for portfolios focused on tech in the broader sense may have been satisfied by the extraordinary growth of Scottish Mortgage (SMT), which sits at c. £14bn in net assets. The two tech trusts have total assets of c. £5.5bn between them – maybe there isn’t £20bn of demand for this sort of portfolio now that rates are around 5%, but more like £17bn or £18bn? If so, then it might take longer than we would like for some of the silliest discounts to close, like the 10.5% on Allianz Technology Trust (ATT). But one way or another they will close, and SMT’s bold buyback announcement has seen its own rating improve already.
Who is issuing shares?
We think that our contention that it is technicals rather than fundamentals that are behind wide discounts is supported by the extraordinary success of a handful of investment trusts which have been able to issue shares while most of their peers are struggling on wide discounts. The table below shows the money raised in the AIC universe in the year-to-date, excluding mergers, and there are a number of patterns that emerge. We note the AIC does warn its data may be incomplete.
Money raised in AIC universe
| MONEY RAISED IN 2024 | |
| JPMorgan Global Growth & Income | £175,650,000 |
| Ashoka India Equity | £31,640,000 |
| Invesco Bond Income Plus | £16,250,000 |
| Rockwood Strategic | £6,140,000 |
| Odyssean Investment Trust | £3,420,000 |
| Merchants Trust | £2,670,000 |
| CQS New City High Yield Fund | £2,010,000 |
| Chelverton UK Dividend Trust | £560,000 |
| CT Global Managed Portfolio Growth | £200,000 |
Source: AIC, data to 01/03/2024
One pattern is that excellent performance can still attract significant flows and see investors willing to invest at NAV. Perhaps differentiation of the strategy is important too. JPMorgan Global Growth & Income (JGGI), for example, has outperformed its benchmark in each of the past five years, including the down year of 2022 in which it was almost flat. It also offers exposure to the large-cap tech trend from a vehicle which pays an attractive yield, thanks to the ability to pay a dividend out of capital reserves. The top holdings are Microsoft, Amazon, Nvidia and TSMC, so packed with growth potential rather than the typical high-yield plays.
Much of the money raised by JGGI came via one major placing of 5.2m shares, following an indication of interest from a wealth manager to make a sizable investment, alongside 1.3m issued direct to retail clients. This raised £34.5m, but the trust has continued to trade on a premium since, the board issuing shares into the market. (Note, we have attempted to exclude the effect of the merger with MATE which completed on 27/03, but we pass on the AIC’s own disclaimer about their statistics.) Clearly if the mandate is right and performance is good, there is still demand from both retail and intermediaries.
Ashoka India Equity (AIE) is another case of strong performance being rewarded. While India has been in favour, the other all-cap vehicles in the sector have been trading on sizable discounts. AIE has been the outstanding performer in the sector since launch and has traded on a premium for most of the time since then. It has managed to raise over £30m in 2024 to date, contributing to total assets rising from £45m at launch to today’s £340m. One differentiating factor behind AIE’s success is the large team of analysts they have devoted purely to Indian equities. Additionally, the charging structure sees a management fee paid only if the trust outperforms the benchmark.
Rockwood Strategic (RKW) is another highly differentiated strategy with a strong track record and has raised £6.1m in 2024 so far. Richard Staveley took over in September 2019, and has handsomely outperformed since then. He runs a highly concentrated portfolio of micro-caps in which he invests with a private equity style approach, seeking to place representatives on the board and engage in order to unlock value in cheap companies. Richard has a significant shareholding, as has Christopher Mills, chief executive of Harwood Capital, RKW’s manager. In fact, Christopher Mills made a major purchase of shares this year, although the 1m he bought compares to a total of c. 3m issued. He now owns c. 27.5% of the company. It is interesting to see strong demand for RKW’s shares despite the small size of the net assets, and we note that as the trust grows a broader base of shareholders should be able to take a meaningful position.
It is interesting to note that JPMorgan American (JAM) has also issued shares and is trading on a small premium at the time of writing. JAM operates in the highly efficient US market, and impressively managed to outperform the S&P 500 in 2023. The dominance of the so-called Magnificent Seven made that a difficult task to achieve, and JAM benefitted from a position in Nvidia, as we discussed in our recent results update. JAM raised £1.4m during the quarter, and has continued to perform well in 2024, with a distinctive strategy that sees it blend a growth portfolio with a value portfolio.
Another trend that jumps out to us is the success of the bond funds. We think this reflects the highly attractive yields now available in the sector. Looking at those raising money, CQS New City High Yield Fund (NCYF) has a trailing yield of 8.7% and Invesco Bond Income Plus (BIPS) 6.7%. BIPS raised £13.4m from a placing aimed largely at retail investors during the quarter. M&G Credit Income (MGCI), which issued a small number of shares in March, has a trailing yield of 8.6%, but this understates the income being generated. MGCI pays a dividend of SONIA plus 4% (of NAV), quarterly, so the real annualised yield is c. 9.2% given where SONIA is. MGCI is a truly flexible strategic bond fund, able to invest across private debt markets as well as public. Currently, 75% of the portfolio is floating rate, which is contributing to the exceptional yield which is delivered from a portfolio of high credit quality – this is an investment grade quality portfolio rather than high yield. We published an updated note on the trust last week. In recent weeks, the trust has slipped out onto a discount once more, but in our view it looks well suited to the current economic environment, although it is true its minimal duration means that it will not benefit from rising capital values much, as and when rates are cut.
Conclusion
It will have been frustrating for investors in closed-ended funds to see their share prices lag NAVs in the rally of recent months. In our view, patience is required. In many of the core equity sectors, we would expect discounts to come in as the move is confirmed – i.e. as the rally seems to have legs, most likely as economic news continues to be reasonable and the first rate cuts are orderly. However, market-wide technical factors could see this take some time, particularly in certain stocks or sectors where demand is lower in a high-rate world. At a market level, we might continue to see discounts persist therefore, but where trusts have differentiated offerings and a strong track record, there is still clearly demand out there – even if some of it is coming at the expense of other vehicles in the sector.

Disclaimer
This is not substantive investment research or a research recommendation, as it does not constitute substantive research or analysis. This material should be considered as general market commentary.
Leave a Reply
You must be logged in to post a comment.