Nov
2021
Stand and deliver
DIY Investor
18 November 2021
This is not substantive investment research or a research recommendation, as it does not constitute substantive research or analysis. This material should be considered as general market commentary.
 Is a high OCF daylight robbery or should investors keep calm and carry on? Our analysts debate the perennial question…
The fees that investors pay for funds have long been a sticking point. There continues to be pressure on managers to keep costs low, thanks to the advent of low-cost tracker strategies and the clear economies of scale to active managers from huge growth in valuations and assets under management.
Yet is this spotlight on fees being shone correctly? Do lower fees equate to better performance? Or is it in fact better to pay up for active management, and thus achieve better returns?
Our analysts argue whether investors should select investments based on lower fees or focus on other factors when selecting a trust.
Cheap is cheerful, and profitable…. – David Johnson
One thing that has certainly kept investors happy over the past few years – alongside that of broadly rising asset values – is the ongoing trend towards cheaper fund fees. It has long been proven that going cheap does not mean forgoing returns, in fact there is some evidence that there is a negative relationship between the two.
Arguably the first time the relationship between good performance and low expenses was highlighted was back in 1966, in a paper[1] written by the famous W.F Sharpe (after whom the ratio is named).
He found that through certain statistical measures a fund’s expense ratio was as good as, if not a better predictor of, performance than the Treynor ratio. In his words: “Selecting a fund with a low ratio of expense to net assets may not be as foolish as some have suggested.” This relationship would go on to be suggested time and time again across varying publications.
Our preliminary analysis on the trust sector shows that, across the AIC’s major listed equity peer groups (US, UK, Europe and Global), there are signs of a negative correlation between the OCF charged by managers and their ability to generate benchmark beating returns. Comparing investment trust ongoing charges with their five-year information ratio[2] found a small statistically significant correlation of -0.11 showing that, on average, the cheaper the OCF (including performance fees), the better the information ratio.
Of course, this proves nothing in itself. Successful funds grow and therefore fixed costs fall, while managers can accept a lower management fee while remaining more profitable than their smaller peers.
However, there are theoretical reasons why this relationship might be expected to hold. Consistent outperformance of the market (adding alpha gross of fees) is hard and rare – particularly in some markets such as the US.
The trusts that cost the least have an advantage in that they reduce the impact of cost drag on their overall returns, increasing the chance that alpha will be added net of fees.
We havepreviously discussed how the chance a manager generates alpha rises as the activeness of his strategy rises, with funds that are less active likely to underperform. Focussing on reducing costs therefore tips the odds in investors’ favour.
Aside from reduced management fees, another trend in the investment trust universe is a slow abandonment of performance fee structures. In the age where passive equity products are increasingly available, professional investment managers do not have the luxury of complacency.
Maybe managers no longer need the motivation of a performance fee to be aligned with their clients given the stronger competitive pressures? It is simply a fact that if clients are fed up with an active manager not delivering good performance, then there is a plethora of cheap, easily accessible passive options for them to move their money into.
Martin Currie Global Portfolio (MNP) reflects this trend; the board have recently seen fit to drop its previous performance fee structure, in favour of a simple tiered OCF which will lower the cost of the trust as it grows.
We understand the motivation for dropping the performance fee is to simplify the fee structure and give the trust the best chance to grow by attracting investors. In all reality, the change in the fee structure is unlikely to affect the motivation of MNP’s manager, Zehrid Osmani, who has so far demonstrated strong outperformance in global equity markets since he was appointed in October 2018.
This performance is all the more impressive given he has been avoiding the big name FAANG stocks which have dominated global equity returns over the past few years.
With the structural advantages that come with a less expensive trust, we would argue there is a clear tailwind behind trusts such as Ballie Gifford Shin Nippon (BGS), whose OCF of 0.71% is far below the simple average 1.26% of the Japanese small cap sector.
Headed up by lead manager Praveen Kumar, the strategy takes a highly active, long-term approach to Japanese small cap investing. BGS offers investors the high active share and price discovery one may associate with higher fee strategies; something we have outlined in great detail in our recently updated note on the trust.
Likewise, Ballie Gifford European Growth (BGEU) also has the lowest OCF in its sector, a mere 0.41%, while still being one of the best performing trusts in the European peer group. The team at BGEU take at least a five-year view to investing into what they believe are Europe’s most unique and entrepreneurial growth opportunities, with a focus on their ability to generate earnings growth over the long term. Over 2020 BGEU began to invest into unlisted securities, which further enhances its potential to access inefficient markets that would normally justify a higher OCF.
[1] Mutual Fund Performance, William F. Sharpe, The Journal of Business, 1966, https://www.jstor.org/stable/2351741?seq=1
[2] The information ratio is a measurement of the differences between a strategy’s returns and that of its benchmark, controlling for the standard deviation in the differences.
If you pay peanuts, you get monkeys… – William Heathcoat Amory
There are always exceptions to any rule. The statistics show that there are enough exceptions to the low fee, higher performance rule that it would pay an observer not to heed it too closely, and the correlation of –0.11 we found between the information ratio and fees is a very low number, implying there are much more important factors determining which manager does best.
It may be that as some academic research suggests, the average fund manager performs in line with the index before fees and therefore underperforms after fees – at least in certain sectors. While one could point to the advantages conferred by the investment trust structure, which helps trusts outperform open ended funds (and their benchmarks) over the long run, it’s hard to disagree.
However, the statistics do show that there are a significant number of managers who don’t have the lowest fees, but whom are still regularly outperforming their benchmarks and delivering amongst the most value through active management.
If the link between fees and outperformance holds then, as fees come down, the number of managers who will outperform their benchmarks should increase. However, the fact that Scottish Mortgage has the highest five-year information ratio in our statistical analysis has nothing to do with its OCF or level of fees. Indeed, the value-add delivered by the managers (as measured by the information ratio) is over twice the average fee for the Global sector.
The reason the manager has outperformed so strongly is, we believe, a result of their willingness to embrace a long-term investment perspective and pay absolutely no attention to the benchmark when constructing the portfolio.
It is not because that they have eked out returns marginally ahead of the index because of their lower costs. As such, the fact that Scottish Mortgage has low fees is largely down to its huge scale (and that of its manager’s partnership structure).
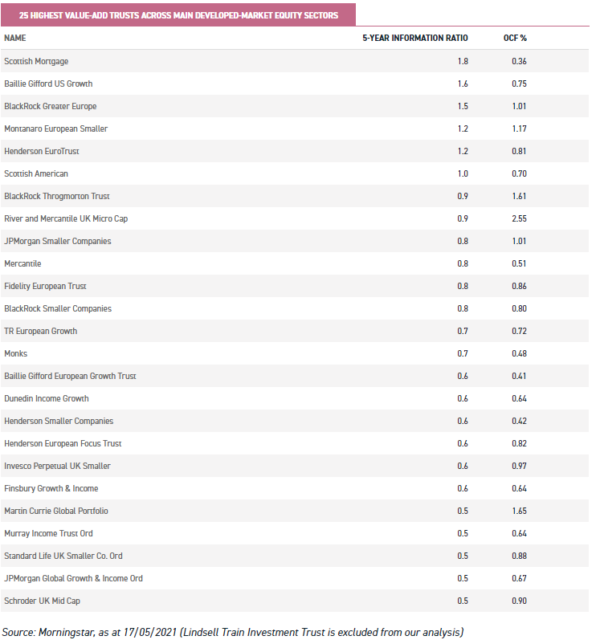
In fact, looking at the top 25 trusts of our sample in terms of information ratio over the past five years (see below), the correlation between costs and performance breaks down.
Using just these top 25 performers, we observe a correlation of 0.02 (though this figure is no longer statistically significant) illustrating no relationship between fees and relative success.
Similarly, the worst performing trusts in terms of information ratio (we will spare their blushes by not publishing them) have a correlation to costs of -0.01. In our view, this is helpful – in that it shows that using costs as a significant input into a buying decision likely has very little predictive power in finding a strongly performing trust. Why might this be?
The last five years have seen globally dominant companies continue to grow at market leading rates.
Given many of these companies have a market capitalisation in excess of $1trn, this has meant that traditional worries about a fund manager’s capacity constraints (in which higher AuM impedes the ability of a manager to continue to outperform) have not reared their head. FAANG stocks are both the largest and most liquid in the world, meaning that managers have been able to be exposed to this dynamic irrespective of their size of AuM.
This is not always the case and, in our view, the areas of the market where managers can most consistently add value over the years are those areas of the market less well covered by analysts, and where there is the possibility for an analytical edge.
Typically, these corners of the investment universe such as Smaller Companies and Private Equity, where there are very definite capacity constraints, and as such higher fees are in our view entirely justifiable. In inefficient markets such as these, the manager has a definite opportunity to add value through stock picking – which if the size of their fund doesn’t expand too far out of line of their universe – should be sustainable over the medium to long term. It goes without saying that if a manager can successfully add value net of fees, and has limited capacity, then there is no question in our mind that they should be justified in charging higher than average fees.
In fact, the devil’s advocate might suggest that investors who are looking for a manager who can add value over time, might be best placed to look for a manager who has been able to justify higher fees to other investors over the longer term.
As my colleague refers to above, if they haven’t delivered value for money and fully justified their fees, then presumably investors would have switched to a cheaper alternative. Perhaps a higher historic fee is actually indicative of quality, or perhaps future performance?
Just because others are happy paying higher fees to a manager, it doesn’t necessarily follow that everyone is. However, in terms of finding managers who are likely to have a high information ratio in the future, we would advocate looking at managers who have a high active share, take a longer term view, and advocate a low turnover approach.
Aside from these characteristics, there also appears to be geographies which suit active management strategies better – such as Europe – for which one might be happy to pay higher fees.
Within our sample, there are seven trusts out of the 25 trusts with the best information ratios who invest in Europe, a significant over representation given European trusts only make up 12% of our sample universe.
BlackRock Greater Europe (BRGE), led by Stefan Gries since June 2017, has a very strong track record of adding value as we show in the table below, placed in third position in terms of information ratio over five years.
In our view, BRGE is an excellent example of a quintessential stock-picking strategy, given the clear bottom-up nature to the investment strategy. BRGE is also one of the few Europe trusts within its AIC sector which also invests in emerging Europe, giving investors access to every region within Europe. The trust’s OCF is higher than the peer group, but in our view (and as the performance would attest to) is a price worth paying.
Irrespective of geography, exposure to smaller companies is also clearly a major influence on the potential for a high information ratio. Of our sample, ten smaller company trusts appear in the top 25 for information ratio.
Invesco Perpetual UK Smaller Companies (IPU) is a case in point, with the managers employing a valuation aware, stock-picking approach that has been unwaveringly consistent over the years. 2020 saw the team take a barbell approach, with around 50% of the portfolio in solid, defensive, growth companies and 50% invested in companies exposed to a cyclical recovery.
In our view this balance puts the trust at a distinct advantage relative to peers in the current environment, with the return profile perhaps less vulnerable to swings in style factor performance. The trust has a slightly higher OCF than the peer group, likely down to its smaller than average asset base. That said, NAV performance has been consistently better than the average – especially on a risk adjusted basis.
These observations fit with the academic literature. In Sheng, Simutin and Zhang’s 2019 Paper, they found that what they define as “high-fee” funds, typically invest “significantly more in companies with high valuation uncertainty: those that have high idiosyncratic volatility, high financial uncertainty, low asset tangibility, and low coverage from sell-side analysts. In essence, “funds investing in hard-to-value companies compensate their managers more richly by charging higher management fees.”
They summarise that after controlling for the underlying exposures, high fee funds perform equally well when compared to low fee funds net of fees. We would highlight the listed private equity sector as illustrating exactly this point (excluded from our sample because of the difficulties of comparing infrequently published NAVs).
Private equity trusts have delivered very good NAV returns net of fees, yet optically have very high charges ratios. It is the unhealthy obsession with OCFs that is in large part responsible (in our view) for the wide discounts that many trusts in the sector stand at.
The essence of what our analysis shows, and what the academic paper we refer to above observes are aligned. For simple, index hugging funds with little active risk being employed, fee considerations are important factor for investors. Indeed, it is likely to be an important determinant of long-term excess returns.
However, for highly active strategies, especially in those which are capacity constrained and in areas which reward fundamental analysis, fee levels are unlikely to provide much of a prediction of future returns or value add. Far more important is the experience and resources of the manager, not to mention the latitude afforded within the mandate.
The investment trust structure provides the ideal environment for those managers who want to take active risk, and be rewarded for it. Indeed, as we discuss in this article perhaps boards should be adding performance fee structures, rather than taking them away. Considering only trusts with the lowest fees leaves investors potentially being led to those who expect to take the lowest active risk, and therefore the lowest potential for excess returns. Pay up, or risk being damned to underperform.
Past performance is not a reliable indicator of future results. The value of investments can fall as well as rise and you may get back less than you invested when you decide to sell your investments. It is strongly recommended that Independent financial advice should be taken before entering into any financial transaction.
The information provided on this website is not intended for distribution to, or use by, any person or entity in any jurisdiction or country where such distribution or use would be contrary to law or regulation or which would subject Kepler Partners LLP to any registration requirement within such jurisdiction or country. In particular, this website is exclusively for non-US Persons. Persons who access this information are required to inform themselves and to comply with any such restrictions.
The information contained in this website is not intended to constitute, and should not be construed as, investment advice. No representation or warranty, express or implied, is given by any person as to the accuracy or completeness of the information and no responsibility or liability is accepted for the accuracy or sufficiency of any of the information, for any errors, omissions or misstatements, negligent or otherwise. Any views and opinions, whilst given in good faith, are subject to change without notice.
This is not an official confirmation of terms and is not a recommendation, offer or solicitation to buy or sell or take any action in relation to any investment mentioned herein. Any prices or quotations contained herein are indicative only.
Kepler Partners LLP (including its partners, employees and representatives) or a connected person may have positions in or options on the securities detailed in this report, and may buy, sell or offer to purchase or sell such securities from time to time, but will at all times be subject to restrictions imposed by the firm’s internal rules. A copy of the firm’s Conflict of Interest policy is available on request.
PLEASE SEE ALSO OUR TERMS AND CONDITIONS
Kepler Partners LLP is authorised and regulated by the Financial Conduct Authority (FRN 480590), registered in England and Wales at 9/10 Savile Row, London W1S 3PF with registered number OC334771.
Commentary » investment trust commentary » Investment trusts Commentary » Investment trusts Latest » Mutual funds Commentary
Leave a Reply
You must be logged in to post a comment.