Jul
2023
Simply the best
DIY Investor
22 July 2023
Investing in high quality companies was a successful strategy for many years, but has its time passed? By Thoman McMahon
In my first job in the industry, I remember coming back from an interview and scoffing at Nick Train referring to his companies as ‘high quality’ – it seemed like a pretty arrogant boast. It was (patiently) explained to me that ‘quality’ had a particular meaning when it comes to equity investing.
It can still seem a pretty nebulous term though, so for the sake of readers who aren’t clear what it refers to let’s consider the MSCI definition. MSCI Quality Indices look at Return on Equity, Debt to Equity, and Earnings Variability. These are calculated for index constituents, and then Z-scores are calculated which place each constituent in relation to the mean. The quality score is an average of these three scores.
MSCI select the highest scoring companies for their indices, subject to some tedious rules intended to ensure concentration, market capitalisation, and the number of constituents are appropriate. Like all quant systems, past data is used, and in this case, it means past 12-month data for the first two metrics and the standard deviation of five-year numbers for earnings variability. These three basic metrics definitely coincide with what active managers tell us they look for, with plenty of individual nuances.
Looking back over the past 20 years, if you could have invested passively in this index (you couldn’t have, iShares launched its ETF in 2014) you would have done pretty well. On a one-year basis, if you had invested in the MSCI World Quality Index rather than the MSCI World Index, you would have been ahead 62% of the time (calculated monthly). Over a three-year basis, returns have been even better: the quality index outperformed in 85% of three-year periods. The chart below shows rolling three-year returns to the world index alongside the three-year outperformance of the quality index versus the world index.
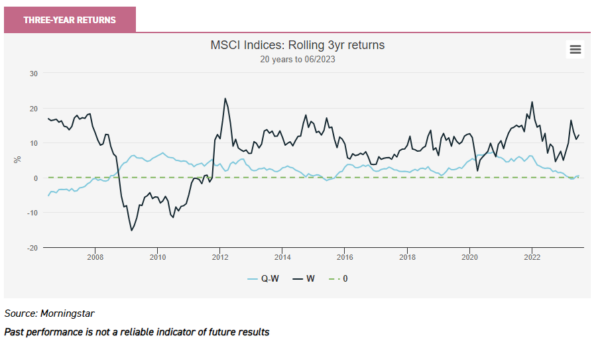
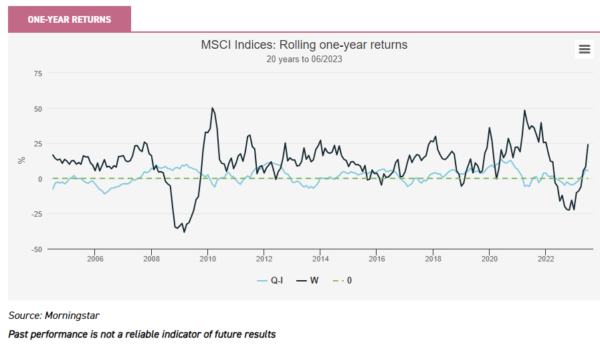
The declining three-year outperformance since 2020 (the falling blue line) reflects weak performance for quality strategies since then. In the one-year rolling chart below it is evident that quality has lost money versus the index for most periods since the start of 2021. What immediately jumps out though, is the sharp outperformance seen in recent months. We will park that thought and return to it later.
Historically we would note a few things from the above charts. Quality did very well on a relative basis in the aftermath of the 2007/2008 crash, which might interest investors who think we are currently in the next big crisis. Quality outperformed when the market was falling, and then underperformed in the recovery. The same pattern can be seen in 2020, and indeed in 2011 when the Eurozone crisis saw global markets fall and quality outperform, only to underperform in the better markets of 2012 and 2013.
All this seems to be out of kilter with what we have seen in 2023. This year, quality has outperformed as the global index has rallied. To explain this, we need to look at how the index has changed in recent years. Remember, the quality index is sector- and country-agnostic: MSCI picks the highest scoring companies for quality, wherever they are and in whatever sector. Over the last ten years, there has been a dramatic increase in the weighting to the US, with 72.2% of the quality index in that country compared to 61.6% 10 years ago. This makes it even more geographically concentrated than the MSCI World Index, where the US makes up 69.4%.
Even more significantly, the quality index is now heavily tilted towards technology. Nvidia is in the largest position in the MSCI World Quality Index, just ahead of Apple. Together they make up 10.5% of the index. Microsoft, Meta, Alphabet and ASML are also top ten holdings, and these six companies together make up 19% of the index. All but Apple have a greater weighting in the quality index than the market cap-weighted index, and the basket is responsible for over 500bps of active weight (see table below).
Nvidia in particular has rocketed away this year on the rage for AI, and other tech stocks have been dragged up with it. The information technology allocation in the quality index has more than doubled to 24% over the past decade, and that doesn’t even include many of the large tech-related stocks which are often correlated to the same trades. Ultimately, this is the main reason for the dramatic uptick in performance for the quality index this year.
TOP TEN HOLDINGS
| HOLDING | COUNTRY | INDEX WEIGHT (%) | GLOBAL INDEX WEIGHT (%) | SECTOR |
| Nvidia | US | 5.30 | 1.84 | Info tech |
| Apple | US | 5.25 | 5.40 | Info tech |
| Microsoft | US | 5.07 | 4.24 | Info tech |
| Meta Platforms | US | 3.25 | 1.12 | Comm Services |
| Visa | US | 2.75 | 0.68 | Financials |
| Lilly (Eli) & Company | US | 2.49 | 0.67 | Health Care |
| Alphabet | US | 2.42 | 1.26 | Comm Services |
| Johnson & Johnson | US | 2.42 | 0.76 | Health care |
| UnitedHealth Group | US | 2.32 | 0.79 | Health care |
| ASML | NL | 2.23 | 0.51 | Info tech |
| TOTAL | 33.5 | 17.27 |
Source: MSCI, as at 30/06/2023
This also explains why some quality growth managers haven’t done as well as the quality index in relative terms: they haven’t all been invested in US tech. In fact, if we look at the regional indices, the difference between the recent performance of quality in the US and elsewhere is stark. Since October 2022, quality has underperformed in Japan and Europe, and is flat against the index in the UK. In the US, it has delivered almost 1000bps of outperformance.
Bear case
Is this really a quality rally then? It’s important to remember when analysing factors that there will always be an answer to which factor is outperforming even if there is no causal connection. We can build an index any way we want, and historical patterns will emerge, but it doesn’t mean that the factor is driving returns rather than simply a data artefact. Should we be interpreting this uptick as a by-product of a rally in large cap, US tech?
Back in May 2021, an esteemed former colleague foresaw the underperformance of quality we have since experienced. Briefly, one of his key arguments was that for various reasons, decadal trends towards bigger companies, increased concentration, and economies of scale were reversing, thanks largely to geopolitical shifts which were seeing a reversal of globalisation and an increasing animosity in the West towards the international arbitrage of labour. A key element in this reversal is the relationship between the US and China, which has been shifting from frenemies to outright confrontation.
Two years, on, we would argue that we can see that deglobalisation is so far something very different. The unmooring of China from the global wharf is very real, but we have seen a shift in manufacturing and FDI to Vietnam, Mexico, Indonesia, and others.
We have seen the emergence of a US-led bloc, but most countries are retaining a studied neutrality between the US and China, and benefitting from investment by both. There definitely has been reshoring, with the US seeing a record number of jobs brought back in 2022 (according to numbers compiled by The Reshoring Initiative), boosted by the Inflation Reduction Act’s protectionist approach to EVs.
There does seem to be more scepticism in the West towards free trade and a shift in power back from capital to labour. But de-globalisation seems to be an exaggeration. Importantly, the quality index is heavy in US companies which are largely not restricted from operating globally, and in the case of US tech companies have prime positions in industries with high margins as well as earnings growth potential in upgrades and new lines of business.
It may get harder for Chinese companies to operate in the US, but is it going to get harder for US companies to operate in Europe? Will shifting manufacturing from China to Vietnam and India lead to a marked drop in profitability for Apple and its competitors, or just some extra one-off costs? We are not convinced.
Another line of argument referred to in our previous note rests on what an inflationary environment means for quality, particularly in contrast to value. We would argue the 2007/2008 crash was deflationary, as was the Eurozone crisis, and the sudden stop to economic activity caused by the 2020 lockdowns. Our current moment is clearly inflationary – could this cause quality to perform differently? Well, we can argue it theoretically. We could point out that quality companies should have greater pricing power and so should be able to protect margins better in an inflationary environment.
However, we would rather focus on data. In Q4 2018, we saw an inflationary pulse flow through markets as Trump’s election led to fears of protectionism and inflation. Quality outperformed. Looking back further, in our 2021 note, our data shows value outperformed quality in the 1980s, a period of high, if declining, inflation. Therefore, we don’t think quality outperforming in an inflationary environment is an anomaly.
Rate cycles
What really needs to be explained in recent patterns is what happened in the major sell-off that started in late 2021 and continued through 2022. Why didn’t quality outperform in this crash as it did in the previous ones? It is not explained by the high representation of US tech in the quality index. Looking at the regional quality indices, they all underperformed the market cap-weighted indices during this falling market. This underperformance is a genuine feature of quality globally.
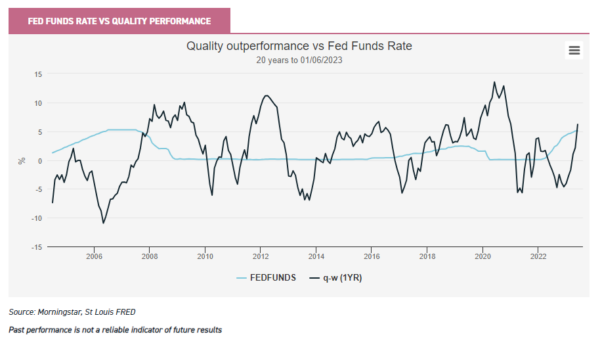
In our view, it is clearly due to the dramatic repricing of assets we have seen following the fastest rate hiking cycle in modern history. The below chart shows the outperformance of quality once more (on a rolling one-year basis) and compares it to US interest rates. Previous rate hiking cycles have been associated with a sell-off in quality versus the market, while rate cuts have led to outperformance.
In this light, the outperformance of quality in recent months makes a lot of sense: equity investors are anticipating an end to the rate hiking cycle in the US and indeed rate cuts. According to the Atlanta Fed, the market expects US rates to rise into September and then fall. The dot plot made from the forecasts of the US Federal Reserve board of governors (the people who make the decision) has rates falling in early 2024.
So equity markets are merely expressing received wisdom in our view – buying the rumour, you could say. In this light, quality’s underperformance last year makes sense. What we actually saw was a repricing in markets while the economy (in the US, UK, and Europe) remained strong. Despite all the negative headlines, economies grew and unemployment was low.
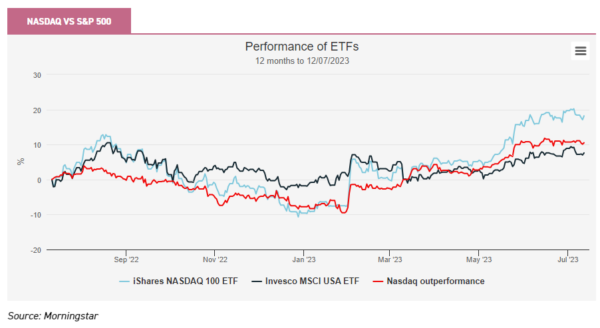
We could view the rally in Nvidia and related names as the market returning to the exuberant excesses that saw penny stocks, bitcoin, NFTs, and other speculative assets surge in 2020 and 2021. It may indeed be the case that Nvidia and some other companies are over-valued – Nvidia’s price-to-sales ratio has gone from 12 to 42.5 since October 2022. However, given the rates dynamic, we are tempted to be optimistic and argue that the current market rally is not an aftershock of recent excesses. Indeed, we would highlight that the outperformance of US large-cap tech began before the emergence of ChatGPT. In fact, it was Q4 2022 when the move began – see the slope of the red line below.
For this reason, we are inclined to see it as the market making a move on rate cuts and rewarding steady large-cap companies with strong competitive positions, strong balance sheets, and high earnings growth baked in – many of which can now be found in the tech ecosystem. Nvidia is a side-show in our view. The history discussed above would suggest if we do get rate cuts, quality will indeed do well once more versus the market, even in a weak overall economic environment. In our view, if this happens the quality rally is likely to last and broaden. This seems most likely to us right now and would be our base case. However, we note the possibility the market has got this wrong. If we see inflation rebound in the US, the American economy weaken, and rate cut expectations pushed out, this may prove to be a false dawn.
How to play a quality rally?
If we are right, then Allianz Technology Trust (ATT) looks like great value on a 12.7% discount. The NAV has performed well year-to-date, to put it mildly, up over 28% at the time of writing. The shares haven’t kept pace though, perhaps as most investors are sceptical about this rally. If or when that changes, we would expect the discount to close, perhaps rapidly. ATT has large positions in Apple, Nvidia, and Alphabet, but otherwise, a mid-cap bias which could see it do well if the rally broadens.
One way this might happen is if US inflation declines rapidly, bringing hopes of rate cuts in. In fact, last week US Core PCE came in at a shockingly low 2.4%. If this is confirmed to be a real move by future prints, then it massively increases the chance the US will escape without a recession – real wage growth will soon be positive. This could lead to mid and small caps doing well, and we would highlight Brown Advisory US Smaller Companies (BASC) in particular. BASC is managed by Chris Berrier with a quality growth strategy. The trust trades on a 16.2% discount at the time of writing, despite a track record of doing very well over the long run.
Quality can be found all over the world and it is not only in strategies focussing on high-growth sectors like tech or small caps. AVI Japan Opportunity (AJOT) takes an activist approach to investing in Japanese small caps. The managers look for companies which are deeply undervalued, and where there is a clear path to unlock that value through corporate action, be that governance changes, dividends, buybacks, or operational changes. Companies that are chosen for the concentrated portfolio need to have high quality underlying businesses which the team think can generate attractive earnings growth. The activist approach has generated good returns in recent years in weak markets, but we think the strategy could get an extra impetus if the economic news improves and quality companies are rewarded. The trust trades on a small discount of 1.8% at the time of writing, having traded on a premium for long periods of time in recent years.
Finally, we must acknowledge that we will not have persuaded everyone. Duncan MacInnes and Jasmine Yeo, managers of Ruffer Investment Company (RICA), argue that inflation is likely to remain higher for longer, and certainly more volatile. They think rates are likely to remain higher for longer as a result, and think growth equities will most likely underperform. RICA performed very well in 2022, but performance has been weaker in 2023. Perhaps for this reason, or perhaps because defensive investors are hiding in cash, the trust is now available on a discount of 3%.

Disclaimer
This is not substantive investment research or a research recommendation, as it does not constitute substantive research or analysis. This material should be considered as general market commentary.
Brokers Latest » Commentary » Investment trusts Commentary » Investment trusts Latest » Latest » Mutual funds Commentary
Leave a Reply
You must be logged in to post a comment.