Feb
2024
Scared of investing when the stock market is at an all-time high? You shouldn’t be
DIY Investor
16 February 2024
While many investors may feel nervous about the potential for a fall, our analysis of stock market returns since 1926 shows that investing at a new high can be profitable – by Duncan Lamont
The US stock market hit a new all-time high in mid-December 2023 and has moved higher since. At the end of January, it was nearly 3% above the previous peak. This has left many investors feeling nervous about the potential for a fall.
Many also switched more of their investments to cash in 2023, attracted by the high rates on offer. The thought of investing that cash-on-the-sidelines when the stock market is at an all-time high feels uncomfortable. But should it?
The conclusion from our analysis of stock market returns since 1926 is unequivocable: no.
The market is actually at an all-time high more often than you might think. Of the 1,176 months since January 1926, the market was at an all-time high in 354 of them, 30% of the time.
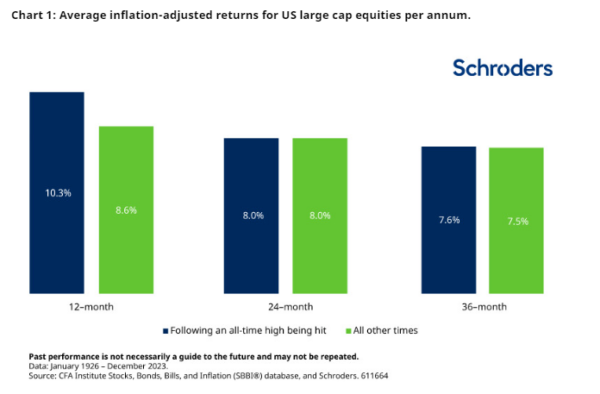
And, on average, 12-month returns following an all-time high being hit have been better than at other times: 10.3% ahead of inflation compared with 8.6% when the market wasn’t at a high. Returns on a two-year or three-year horizon have been slightly better on average too (see Chart 1).
Differences compound over time
$100 invested in the US stock market in January 1926 would be worth $85,008 at the end of 2023 in inflation-adjusted terms, growth of 7.1% a year.* In contrast, a strategy which switched out of the market and into cash for the next month whenever the market hit an all-time high (and went back in again whenever it wasn’t at one) would only be worth $8,790 (see Chart 2). This is 90% lower! The return on this portfolio would have been 4.7% in inflation-adjusted terms. Over long time horizons, differences in returns can seriously add up.
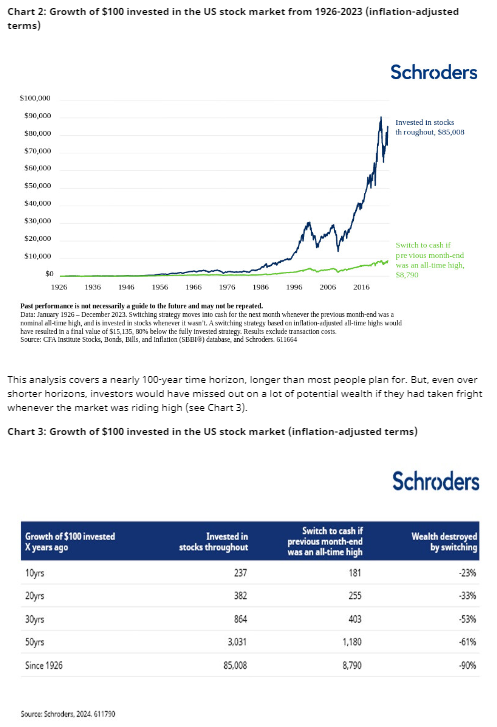
Don’t fret over all-time highs
It is normal to feel nervous about investing when the stock market is at an all-time high, but history suggests that giving in to that feeling would have been very damaging for your wealth. There may be valid reasons for you to dislike stocks. But the market being at an all-time high should not be one of them.
*The annual real growth of 7.1% is calculated as a compound annual growth rate (CAGR) and is not just a simple average of all the periods. When taking a simple average of all the periods there may be some years with positive growth and some with negative growth (i.e. growth will vary from year to year). With a compound annualgrowth rate, it calculates what constant growth rate would have had to occur every year.
![]()
Important information
This communication is marketing material. The views and opinions contained herein are those of the named author(s) on this page, and may not necessarily represent views expressed or reflected in other Schroders communications, strategies or funds.
This document is intended to be for information purposes only and it is not intended as promotional material in any respect. The material is not intended as an offer or solicitation for the purchase or sale of any financial instrument. The material is not intended to provide, and should not be relied on for, accounting, legal or tax advice, or investment recommendations. Information herein is believed to be reliable but Schroder Investment Management Ltd (Schroders) does not warrant its completeness or accuracy.
The data has been sourced by Schroders and should be independently verified before further publication or use. No responsibility can be accepted for error of fact or opinion. This does not exclude or restrict any duty or liability that Schroders has to its customers under the Financial Services and Markets Act 2000 (as amended from time to time) or any other regulatory system. Reliance should not be placed on the views and information in the document when taking individual investment and/or strategic decisions.
Past Performance is not a guide to future performance. The value of investments and the income from them may go down as well as up and investors may not get back the amounts originally invested. Exchange rate changes may cause the value of any overseas investments to rise or fall.
Any sectors, securities, regions or countries shown above are for illustrative purposes only and are not to be considered a recommendation to buy or sell.
The forecasts included should not be relied upon, are not guaranteed and are provided only as at the date of issue. Our forecasts are based on our own assumptions which may change. Forecasts and assumptions may be affected by external economic or other factors.
Issued by Schroder Unit Trusts Limited, 1 London Wall Place, London EC2Y 5AU. Registered Number 4191730 England. Authorised and regulated by the Financial Conduct Authority.
Leave a Reply
You must be logged in to post a comment.