Nov
2024
Investing Basics: MSCI Vs FTSE: Which is the best index provider?
DIY Investor
24 November 2024
An ETF’s results depend on its index. We explain the differences between the two major global index providers and why you shouldn’t mix the two – writes Dominique Riedl
Brand awareness counts, and that’s as true for the stock markets of London, New York, Paris and Milan as it is for the fashion houses.
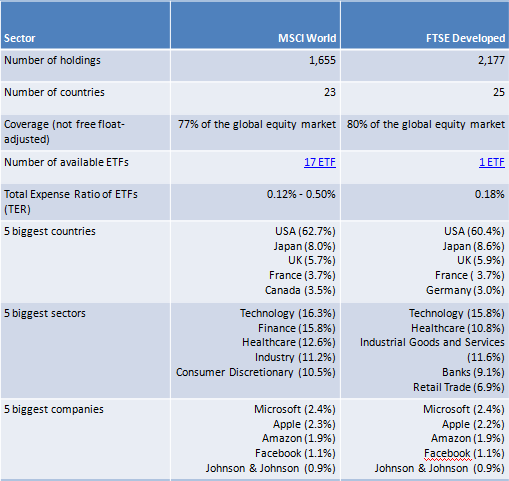
When ETF managers partner up their products with an index provider, the evidence is that they choose the big name. Look at the critical developed world category.
The MSCI World index utterly dominates the field: with 13 MSCI World ETFs (as of December 2018) lining up against a single FTSE Developed World ETF (not including factor or sector tilts).
MSCI is also the go-to index provider in the emerging markets space: 10 to 1 vs FTSE for vanilla ETFs.
It’s only once you drill down into regions and countries that other index providers such as STOXX, S&P and even FTSE play a significant role. Despite MSCI’s global dominance, there is little obvious difference between their offering and FTSE’s: both offer broadly diversified, market capitalisation-weighted indices. But the devil is in the detail and you can only flush that out with a deep-dive into the two providers’ index methodologies.
MSCI Vs FTSE: the differences
The biggest discrepancy between the two index providers is whether they count certain countries as developed or emerging markets. For example, South Korea is classified as an emerging nation by MSCI but has been promoted to developed market status by FTSE.
Therefore South Korea is included in FTSE’s developed market index but not its emerging market one, and vice versa for MSCI.
Meanwhile, Poland was upgraded to developed status by FTSE on September 24 2018, whereas MSCI remains unpersuaded – leaving Poland in its emerging market league for now.
Saudi Arabia is a different story. FTSE included Saudi shares in its emerging market index in March 2019, MSCI in June 2019.
The handling of Chinese shares may prove more significant in the long run. Chinese shares are divided into distinct classes that provide different exposures to Chinese firms.
Historically, some of these classes were available to foreign investors and some were reserved for Chinese domestic investors – specifically the A-shares.
However, as the Chinese economy opens up, the supply of A-shares available to foreign investment institutions is increasing. This development is likely to lead to a major tilt of emerging market indices toward China, and expose investors to new Chinese investment opportunities.
MSCI has been feeding Chinese A-shares into its emerging markets index since June 2018. Initially, they limited inclusion to 5% of the investable A-share universe by market cap.
However, the move has proved popular and MSCI are increasing their A-share market cap successively.
FTSE introduced around 1,200 A-share firms to their emerging market index in June 2019.
The 25% inclusion of the investable A-share market cap leads to an amount of 5.5% share of the FTSE Emerging Market Index. Again this number is likely to increase over the forthcoming years as China’s capital market regulations improve access and corporate governance.
MSCI vs FTSE: Individual country weights by index
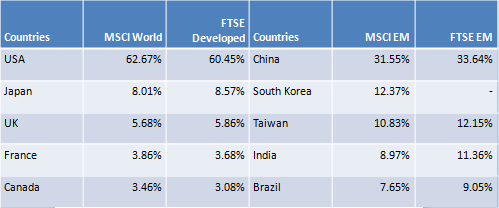
Source: FTSE, MSCI; as of 28/06/2019
The contrast in index composition is clearer in the emerging markets because South Korea makes a big difference at this level.
It’s the second-largest country in the MSCI Emerging Markets Index and so its absence in the FTSE index tends to concentrate its holdings in the other major players.
Small-cap firms cause another material difference between the indices. MSCI global indices capture 85% of the investable universe by market cap and exclude the bottom 15% as small-cap firms. But FTSE global indices track 90% of market capitalisation and exclude the bottom 10% as small-cap firms.
Essentially, FTSE scoops up some companies that MSCI define as small-cap, which explains why FTSE indices usually contain more companies.
MSCI vs FTSE: Number of shares by index
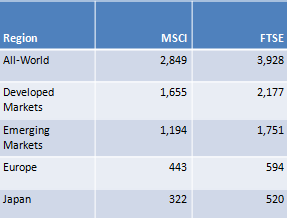
Source: FTSE, MSCI; as of 28/06/2019
Although more companies are included in the FTSE indices, their relatively small size tends to limit their impact.
MSCI Vs FTSE: performance
The performance difference has been negligible between the MSCI World and FTSE Developed indices as you can see in this comparison between popular ETFs that track the two.
Performance comparison: MSCI Vs. FTSE – Developed Markets (30/09/2014 – 13/07/2019)
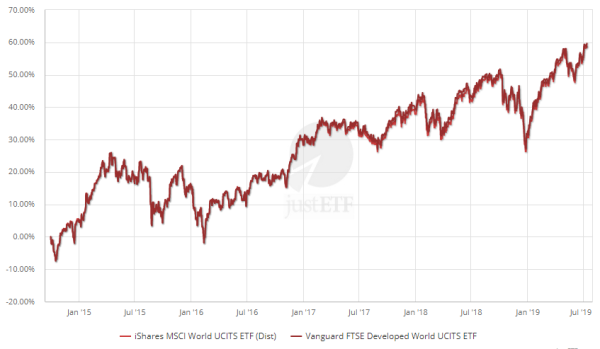
Source: justETF Research; as of 14/07/2019
You can barely slip a sheet of paper between the results of Vanguard’s FTSE Developed World ETF and iShares MSCI World ETF as the differences in index composition aren’t enough to noticeably move the needle.
But the same is not true for the emerging markets. Since launch, the Vanguard FTSE Emerging Markets ETF (+56,75%) has outperformed the iShares ETF MSCI Emerging Markets ETF (+48,75%).
Of course, there’s no reason to believe that FTSE’s advantage will hold over the long run. MSCI could overhaul FTSE if future results unfold in favour of its emerging market index composition. For example, if South Korea overperformed relative to other holdings in its index.
MSCI Vs. FTSE – Emerging Markets (30/09/2014 – 13/07/2019)
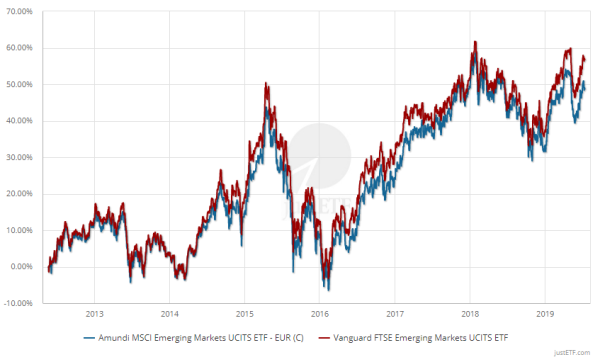
Quelle: justETF Research; as of 14/07/2019
Small deviations in index construction may make a bigger difference at the regional or country level. This is where paying close attention to different index methodologies can pay off.
For example, how much small-cap exposure do you get? What mix of share classes is a China ETF exposed to? Are you tracking a total stock market index which is less likely to saddle your ETF with dealing costs due to constituent company turnover?
What does that mean in concrete terms?
The broader your index, the more likely it is to deliver comparable results to its rivals over the medium and long-term. And you can’t get broader than a global ETF so focus on the cost of the product here rather than the finer details of index construction.
For example, the cheapest MSCI World ETF currently sports a Total Expense Ratio (TER) of 0.12%.
That’s significantly cheaper than the 0.18% TER of the only FTSE Developed ETF. Similarly, the cheapest MSCI Emerging Markets ETF costs 0.18%, while the FTSE Emerging Markets ETF costs 0.25%.
The situation is reversed among All-World products that combine developed and emerging markets in a single index. The FTSE All-World ETF costs 0.25% versus 0.4% for the cheapest MSCI All-Country World ETF.
However, try to avoid mixing index providers in your portfolio at the broad market level. For example, if you combine an MSCI World ETF with a FTSE Emerging Markets ETF, then you won’t have any exposure to South Korea or Poland.
Meanwhile, you’ll hold both those markets twice if you take the FTSE Developed World ETF along with an MSCI Emerging Markets ETF.
MSCI World Index vs FTSE Developed Index in detail

Leave a Reply
You must be logged in to post a comment.