Sep
2020
Making sense of equities in 2020
DIY Investor
14 September 2020


Key takeaways
- The market sell-off in March was remarkable for its speed and ferocity, likely amplified by algorithmic trading strategies forced to sell stocks as the economic impact of the pandemic grew.
- However, large tech and communications companies proved resilient, lifting some indices off recent lows and inflating index price-to-earnings ratios*.
- Most stocks remain in bear-market territory. For investors, we believe the key is to test assumptions about a company’s long-term growth and consider whether current share prices reflect longer-term earnings trajectories.
In early 2020, the outlook for the global economy seemed promising. China and the U.S. were making progress on trade talks. In the UK, Prime Minister Boris Johnson negotiated the country’s exit from the European Union, providing a sense of finality.
U.S. unemployment was at record lows and declining. Global gross domestic product was growing in the most robust manner in more than a decade, helping fuel global equities to all-time highs.
Then news arrived in late February of a novel coronavirus – one that emerged in China in December but was largely contained to Southeast Asia – aggressively spreading in northern Italy and much of Europe.
Facing the risk of a global pandemic, the economic outlook changed dramatically. Just as the reality of a global pandemic was developing, Saudi Arabia and Russia entered into an oil price war.
This price war, at a time when oil demand was falling off a cliff, caused crude prices to crater quickly and further compounded the uncertainty around economic activity. The S&P 500® Index fell 8% in one day.
Then 10%, then 12%. By mid-March, the benchmark declined 34% in just 23 trading days, entering bear-market territory in record time.[1]
Uncharted territory
The market decline reflected the potential deleterious impact of the COVID-19 coronavirus on the global economy. As entire countries locked down their societies to slow the virus’s spread, business activity across many industries ground to a halt.
The damage soon piled up. In the U.S., month-over-month retail sales fell a record 16.4% in April (following a decline of 8.3% in March).[2] Germany and Japan entered a recession, with Germany’s economy shrinking 2.2% during the first quarter and Japan’s 3.4%.[3] In light of plummeting air travel, Singapore Airlines cut passenger capacity by 96% from April through June.[4]
The drawdown was remarkable for its speed and ferocity and was likely amplified by market structures known as algorithmic, or model-driven, trading strategies.
These strategies, which surged in popularity in recent years and by our estimate now make up some 60% of all trading activity, use computer models to buy or sell stocks based on factors such as risk parity, momentum, liquidity or volatility.
Often, leverage is employed to enhance returns. As the outlook for 2020 abruptly changed and market dynamics shifted, these models triggered swift and intense selling to try to keep portfolio characteristics within predefined ranges.
Funds using leverage were under even more pressure to meet margin calls or reduce risk. These actions fueled the market’s downward momentum and caused liquidity to tighten.
U.S. EQUITY MARKET VOLATILITY AND VOLUME
Algorithmic selling aggravated the market’s decline as positions were often exited at any price. As liquidity became scarce, relative trading volumes and depth lagged.
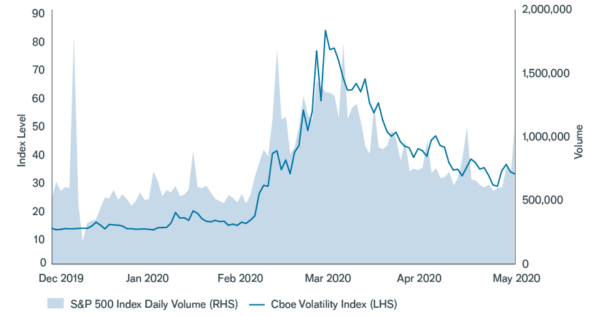
Source: Bloomberg, data from 13 December 2019 to 15 May 2020.
Average returns vs. typical stock performance
However, as painful as the sell-off was, it didn’t seem to last long. Many widely followed indices have retraced at least part of their losses since March, with some benchmarks, such as the tech-heavy NASDAQ Composite Index, now essentially flat for the year.[5]
Look closer, though, and it becomes clear the rebound lacked breadth. As shown in the chart below, most of the gains are concentrated in a handful of mega-cap tech and communications firms, which benefited from rising demand for digital solutions during the pandemic and from their cash-rich balance sheets.
The influence of these stocks is unprecedented. Just five companies – Amazon, Apple, Facebook, Google and Microsoft – constitute nearly 50% of the NASDAQ, as well as significant portions of the Russell 1000® Growth Index and the S&P 500.[6]
But while the largest five stocks helped lift the average return of indices, the performance of the typical stock looks vastly different, with many shares remaining deeply in the red. Value stocks (i.e., equities that appear inexpensive relative to a company’s underlying fundamentals) are still in bear-market territory.
Small-cap shares, as measured by the Russell 2000® Index, are down 24% year to date, with micro-cap companies tending to lag by a much wider margin as investors worry about these companies’ ability to access capital and repay debt amid plummeting revenues.
2020 U.S. EQUITY RETURNS
The largest tech and communications companies have far outpaced the broader market.
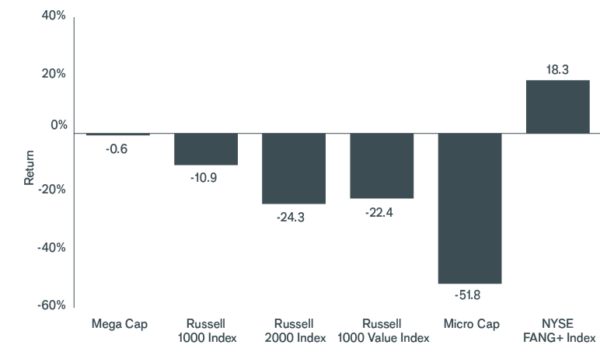
Source: Bloomberg, data are year to date through 15 May 2020. NYSE FANG+ is an equal-dollar weighted index comprised of select highly traded mega-cap technology and consumer discretionary stocks.
Perhaps most surprising, stocks that performed the worst during the sell-off did not carry high multiples heading into the pandemic. On the contrary, many of these equities possessed price-to-earnings (P/E) ratios that looked attractive compared to the index average or history.
Conversely, the P/Es of mega-cap stocks sat in the top quintile.
Many who thought higher valuations presented risk prior to the outbreak and positioned themselves more defensively from a valuation perspective, but perhaps not from a business model perspective, suffered.
The conundrum: what are stocks worth now?
This bifurcation skewed P/E averages, with some benchmarks trading at a premium to historical levels.
The challenge now is discerning what represents attractive risk/reward opportunities, particularly when earnings and revenue forecasts are often impossible to forecast given the unpredictability of the pandemic.
Economies are slowly reopening, but COVID-19 continues to present significant health risks and there remains the uncertainty as to subsequent outbreaks later this year. Against this backdrop, we think it is critical to look through the average and study companies case by case.
What aspects of the economy are permanently impacted – positively or negatively – as a result of changes to consumer behavior or industry needs? What industries will likely recover, and what new opportunities could be created?
S&P 500 INDEX FORWARD P/E RATIO
The S&P 500’s 45% premium to its long-term average is influenced by its five largest holdings; excluding those, the index trades at a still elevated – but more manageable – 21% premium.
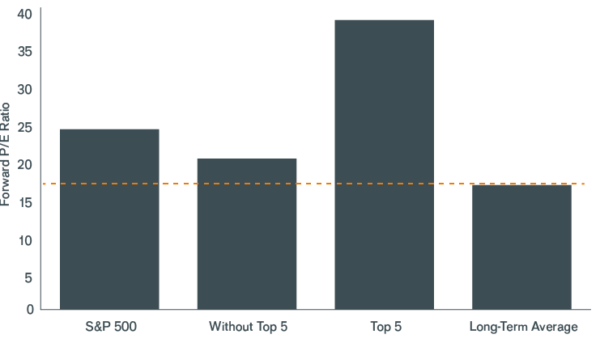
Source: Bloomberg, data as of 18 May 2020. P/Es based on full-year 2020 earnings estimates. Long-term average reflects data from March 1990 to May 2020
When viewed through that lens, firms trading at high multiples but likely to grow at accelerated trajectories may warrant steep price tags. Meanwhile, some beaten-up stocks could be attractively valued if the underlying businesses remain viable over the long term.
For firms where the outlook is dubious – whether because of secular* economic shifts or heavy debt loads – a cheap stock price may not be sufficient reason to invest.
We think investors should brace for continued uncertainty for the remainder of the year. But even amid a volatile backdrop, staying true to time-honored investing principles – focusing on business fundamentals, testing and retesting assumptions and staying mindful of price – should serve investors well over the long term.
[1] Bloomberg. A bear market is a decline of 20% or more.[2] U.S. Census Bureau, as of 15 May 2020.
[3] Destasis Satistisches Bundesamt, as of 15 May 2020; Economic and Social Research Institute of Japan, as of 18 May 2020.
[4] Company report, as of 14 May 2020.
[5] Bloomberg, as of 15 May 2020.
[6] Bloomberg, as of 15 May 2020.
Click to visit:
*Price-to-Earnings (P/E) Ratio: A popular ratio used to value a company’s shares. It is calculated by dividing the current share price by its earnings per share. In general, a high P/E ratio indicates that investors expect strong earnings growth in the future, although a (temporary) collapse in earnings can also lead to a high P/E ratio.
*Secular: Secular themes and trends are not seasonal or cyclical. They are long term in nature.
These are the views of the author at the time of publication and may differ from the views of other individuals/teams at Janus Henderson Investors. Any securities, funds, sectors and indices mentioned within this article do not constitute or form part of any offer or solicitation to buy or sell them.
Past performance is not a guide to future performance. The value of an investment and the income from it can fall as well as rise and you may not get back the amount originally invested.
The information in this article does not qualify as an investment recommendation.
For promotional purposes.
Commentary » Equities » Equities Commentary » Equities Latest » Investment trusts Commentary » Latest » Mutual funds Commentary
Leave a Reply
You must be logged in to post a comment.