Jun
2023
Let’s go round again
DIY Investor
17 June 2023
Discounts have ballooned across the investment trust world, but our analysis shows we’ve been here before…by Ryan Lightfoot-Aminoff
The news has been awash with stories of a pending recession. Barely a week passes without another warning light flashing red or an economist making ominous comments on the state of the economy. This commentary though, hasn’t all been one way.
There have been a number of conflicting data points and forecasts, not least of all from the Bank of England whose position has shifted from expecting a heavy recession to now forecasting no recession at all, all in just a six-month period. We are clearly in a volatile environment and the range of outcomes for markets is particularly wide.
Rather than predict what this means for investment trusts, we have taken a look back at history to see how discounts behaved during periods of notable market movements, with a particular focus on the 2008 financial crisis and the recovery, and ask whether this can provide any insights for investors in the current uncertainty.
Returns versus discounts
To evaluate the impact of market movements on discounts, we have analysed 20 years’ worth of rolling three-monthly returns from three major indices, i.e. MSCI World Index, FTSE All-Share Index and Euro Stoxx Index, and compared them with the aggregate discounts of the investment trust universe.
The chart below highlights clearly strong market movements, i.e. the three-month periods where the indices have risen or fallen the most. The most prominent of these is the 2008 financial crisis, which had a significant impact on markets for years to come. We have then overlayed rolling average discounts to determine how these have behaved across the period, including over the periods of most market stress.
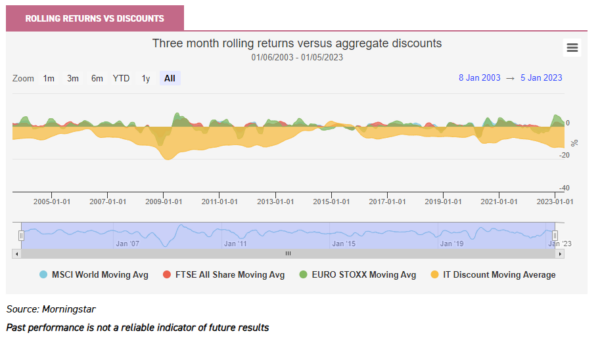
The chart shows quite demonstrably that the periods of market stress where the rolling returns for the indices have fallen the most are those that have seen the biggest widening in discounts. This is hardly a revelatory takeaway, but the pattern of how this occurs is interesting and may offer some insight for investors.
Whilst discounts fall in line with markets in difficult periods, there is often a limited bounce when the immediate pain is over. However, after this, they generally take a longer period to recover to their pre-shock levels. The 2008 market collapse is the strongest example of this.
Markets fell sharply from late summer to the end of the year, as the emerging financial crisis led to the collapse of Lehman Brothers. From this point, discounts of investment trusts widened significantly and, whilst markets had returned to pre-Lehman levels broadly a year later, it took a further two years for aggregate discounts to narrow to the point they were pre-crisis.
There are, arguably, two factors at play here. One is investors’ attitudes towards markets, with fear driving down share prices as investors sell. The other is the sentiment around the NAVs of private assets.
Private assets have come to make up an increasingly large proportion of the assets held in the closed-ended fund universe. As at 31/05/2023, 16.8% of the value of the assets in the AIC universe were private assets, with infrastructure and renewables increasingly popular. The equivalent figure just before the worst of the financial crisis, on 31/07/2008, was just 3.3%.
The NAVs on these asset classes will be calculated periodically. In some sectors, such as property, they are valued off market comparables, and in others, off discount rates, which are periodically adjusted by the manager.
Both of these methods inject a lag, so valuations can often be out of date. As such, NAVs on assets such as property and infrastructure often lag wider markets. As such, investors may front run these expected NAV falls, which may take some time to play out.
We saw discounts widen sharply in 2020 as the market impact of Covid played out, and then again in 2022, as concerns over the comeback of inflation has taken its toll. It should be noted that the period of relatively positive performance for investment trust discounts after the 2008 crisis came as interest rates collapsed.
This encouraged investors to shift from savings, where they would earn very little interest, into markets where income was often higher and returns better. This also contributed to the expansion in the likes of the infrastructure and property sectors, as investor demand for yielding alternatives grew.
Investment trusts responded in turn by issuing vast amounts of shares, which led to them becoming such a large part of the investment trust universe. However, this has arguably reversed recently, as investors are now able to earn interest in bank accounts and assets that are perceived to be safer, such as government bonds.
This may be contributing to the wider discounts we are currently seeing. Meanwhile, if government bonds yield more, arguably the share prices of high-yielding alternatives need to be lower and, therefore, discounts wider.
Overall, we believe these periods demonstrate that discounts appear to be quite brittle. They can often drop sharply when market conditions weaken and take a little longer than broader markets to recover. However, when market conditions are benign, discounts appear to narrow steadily over time as confidence returns.
The data also shows limited correlation between monthly rolling returns and discount levels over the long term. The correlation between the rolling monthly returns of the MSCI World Index and the change in the average investment trust discount over the 20-year period is just 0.12, and 0.06 to the FTSE All-Share Index’s returns.
However, when we restrict the analysis to periods of market falls, it increases significantly. For the 12-month period that incorporates the 2008 market collapse, this same correlation between the MSCI World Index and discounts climbed to 0.5. This reinforces the view that discounts fall in line with equity markets in crises, but react differently outside of this.
Lessons for today
In the past 18 months, discounts have widened notably as markets have been particularly challenging in the short term. The resurgence of inflation has led to interest rates rising and bringing the valuation of assets into question, while there have also been heightened geopolitical issues.
Investment trust discounts have widened as markets fell, just as they did in 2008, after the financial crisis. Markets struggled in 2022, especially in the first half of the year, as rising inflation was further fuelled by the Russian invasion of Ukraine, causing a massive spike in energy costs and the knock-on effects elsewhere in the economy.
Since then, there has been a significant bounce in the equity indices. The MSCI World Index is up over 7% from the beginning of 2023 to date, and the FTSE All-Share Index is up over 4%. This is despite the fallout of a mini banking crisis in mid-March, which wiped out any gains these indices had made to that point. In this period, though, discounts have continued to widen, as we show in the chart below.
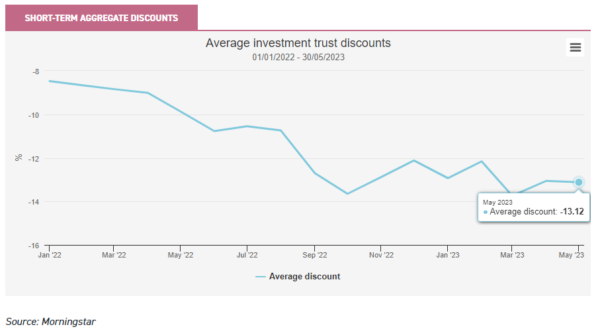
It may be that markets and discounts are following the same pattern we identified above, as following the 2008 crisis: discounts correlated with markets on the way down, but were slow to react on the way back up.
As such, this could be seen as an opportunity for long-term investors, should the recent rally in markets signal we are at the bottom of the cycle. Markets have gone through a period of significant turmoil in the past 18 months and investment trust discounts have fallen as a result, but while markets seem to have shrugged off these concerns and recovered, this optimism doesn’t seem to have fed through to investment trusts yet and discounts have yet to recover.
The contrasting profile of the universe may be a contributing factor. The non-equity portion of the investment trust universe has grown considerably since 2008. As we have discussed, the NAVs of assets such as infrastructure and property often lag equity markets, meaning there may be some revaluations to come in these sectors.
However, many of the managers of these trusts argue that discounts are already reflecting all of this negativity, and more. Furthermore, looking behind the investment trust universe average discount, we think the discounts of many equity sectors look interesting.
Trusts to consider
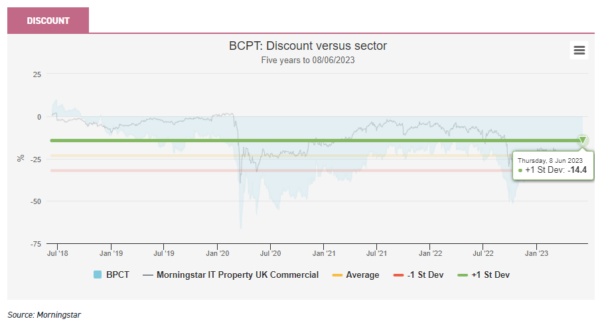
One sector where discounts look particularly wide is UK commercial property. Discounts across the sector widened in the first half of 2022, which we largely attribute to fears that higher rates would lead to property being revalued downwards. One trust that currently trades particularly widely, even versus its peer group, is Balanced Commercial Property (BCPT). The current discount stands at 31.6% versus the sector peer group’s 21.7% and its five-year average of 23.3%.
The current discount is almost one standard deviation wider than the five-year average. We think BCPT has a high-quality portfolio, thanks partly to the asset management that has gone on behind the scenes with the trust. Manager Richard Kirby has extensive experience in the sector and has managed BCPT since 2005.
He has used this experience to rebalance the portfolio by reducing a number of office and retail assets at good valuations, in order to increase the exposure to the industrial sector, in particular logistics warehouses, which are set to benefit from the long-term structural trend towards online retail.
As we discussed in a recent note, we think the write-downs in the property sector have probably mostly been taken, so the wide discount could prove a good opportunity for long-term investors, even if we may need to see gilt yields start to fall before the discount materially closes.
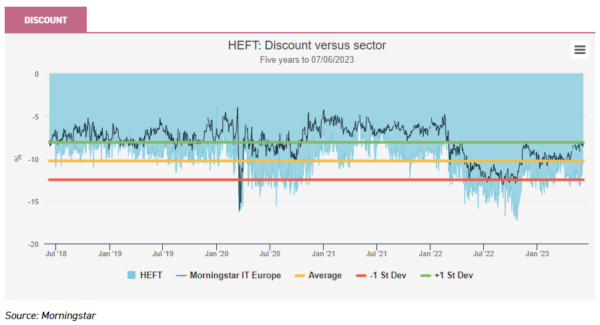
Another area that has come under particular pressure in the past few years is European equities and the AIC Europe sector has a number of trusts at wide discounts. One of these is Henderson European Focus Trust (HEFT), which is co-managed by John Bennett and Tom O’Hara.
They take a long-term, bottom-up approach towards building the relatively concentrated portfolio from predominantly large firms in Europe. HEFT stands out compared to most peers in the AIC Europe sector due to the managers’ flexibility to invest across the style spectrum and not into just the growth companies that often dominate the portfolios of their peer groups.
This has led to a period of outperformance for the managers over the past couple of years, as the growth-orientated stocks have sold off. Despite this, the discount of the trust has remained stubbornly wide. We believe this is a result of general market uncertainty, caused by the geopolitical issues, rather than a judgement on the performance of the trust itself.
The discount currently stands at 10.3%, wider than the peer group average of 8.3% and in line with its five-year average, though we note the discount was one standard deviation wider than its history very recently. Considering the long-term stock-selection capabilities of the managers and the flexible approach, we believe this discount may prove opportunistic.
Finally, a piece on wide discounts wouldn’t be complete without a mention of the UK. The travails of the UK stock market have been well-publicised and something we have previously discussed. Since the Brexit referendum, UK equities have been out of favour and discounts have generally widened since, albeit with a few exceptions.
The UK smaller companies sector is one area that has struggled in particular. Smaller companies are often those that suffer most in periods of market weakness, due to a number of factors. They are often more focussed on a single industry, with a smaller client base, meaning they cannot fall back on a diversified range of products to support the business during market weakness.
The higher interest rate environment is also likely to be a headwind, as smaller firms are often first to struggle with accessing debt financing during downturns as banks tighten their lending criteria.
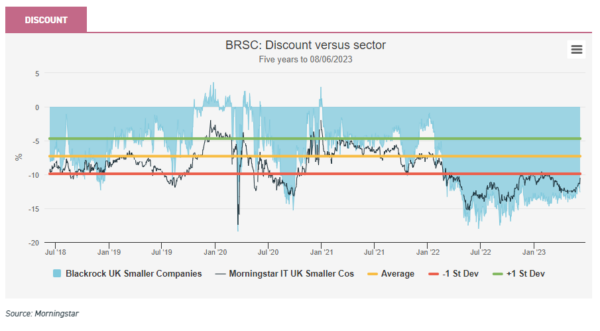
One notable example of a UK smaller companies trust whose discount has widened is BlackRock Smaller Companies (BRSC). The trust is managed by Roland Arnold, who aims to identify superior, long-term growth opportunities through a portfolio of high-quality companies at the smaller end of the market-cap spectrum.
This approach has been in favour for much of the past five years but, more recently, the rotation to a preference for value companies and the wider negativity towards the UK have led to the discount widening markedly.
The discount now stands at 12.6%, more than one standard deviation wider than the five-year average of 7.3% and wider than the sector average of 10.5%. Roland has continued to employ the same strategy that has been in place since 2004, which has proved beneficial to investors, so the current discount could be seen as an attractive entry point.
Conclusion
Headlines have not been kind to markets in the past year. There has been considerable uncertainty about a potential range of economic outcomes and this has taken its toll on investors, particularly so through investment trust discounts, with aggregate discounts approaching levels not seen since the financial crisis of 2008.
With discounts having fallen notably over the past 18 months, they are arguably pricing in a lot of negativity. Our analysis of history shows that there has tended to be a lag between underlying market rebounds and investment trust discounts, so we think the stage might be set for another slow grinding in, such as we saw after the financial crisis.
This time, though, interest rates are a headwind, rather than being supportive to markets. If rates remain higher for longer, it could have a notable impact on sectors such as infrastructure, which are priced off them and which need to offer a higher yield than gilts to justify their higher risks.
We think there are a number of sectors where concerns about interest rates have contributed to widened discounts, but these have arguably been exacerbated by wider economic concerns and the impact of a recession, in particular on UK smaller companies and property. Should recent optimism about the economy prove correct, the current wide discounts could prove an attractive entry point for long-term investors.

Disclaimer
This is not substantive investment research or a research recommendation, as it does not constitute substantive research or analysis. This material should be considered as general market commentary.
Brokers Commentary » Commentary » Investment trusts Commentary » Investment trusts Latest » Latest » Mutual funds Commentary
Leave a Reply
You must be logged in to post a comment.