Apr
2022
Is the yield curve signalling recession?
DIY Investor
24 April 2022
 Here’s why we should not ignore the US yield curve – by James Molony
The US “yield curve”, or part of it, has “inverted” once more. This bond market measure has been a reliable predictor of US recessions over the last four decades.
With only one exception, each time the yield curve has inverted, the US economy has entered a downturn within 18 months.
What is the yield curve?
The yield curve is the difference between the interest rate on a longer-dated bond and a shorter-dated bond. Bonds are debt issued by a country or a company.
For instance, typically it should cost less to borrow money for two years than for 10 years. This is because the economy is expected to grow over time and experience inflation, which erodes the value of money. A healthy yield curve should therefore slope upwards.
What happens when it doesn’t?
When it costs more to borrow money in the short term than it does in the long term, the yield curve slopes downwards – that is, it inverts.
At best, an inversion suggests that investors expect the economy to slow, at worst it signals a recession could be on the way.
Why does the yield curve matter?
Tina Fong, Economist, said:
“The conditions for a recession are growing, notably the pressures facing US consumers. And so too are the quantitative signals, notably the inversion of the 2 to 10-year yield curve, which has been a reliable indicator of impending recession in the past.
“The Federal Reserve (Fed) is not concerned about a recession yet. The reason for this seems to be found in its focus on the very short-end of the curve. Namely, bonds that will mature in less than 2 years.
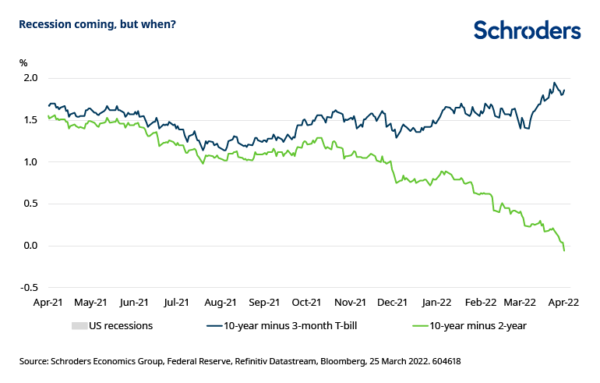
“Here, the central bank is focused on the interest on a 3-month bond today being considerably lower than where it is expected to be in 18 months’ time. The 10-year yield minus 3-month Treasury yield curve also remains steeper. It is far from inverted.
“In the past, the 2 to 10-year curve has inverted anywhere from 31 to 126 days earlier than the 3-month to 10-year curve. So it is telling us that a recession is now likely, but doesn’t tell us that much about when it will happen. As the Fed highlights, the real red flag comes from the 3-month yield. When that flattens toward future expectations and the 10-year yield it spells a potential economic downturn.”
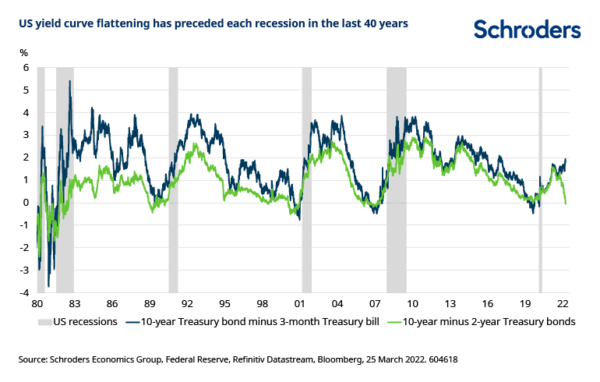
The charts below show the difference between 2 and 10-year, and 3-month to 10-year government bond yields in the US, which creates the yield curve. The second chart shows the instances over the past 40 years where yield curve inversion has preceded recessions.
Important information
This communication is marketing material. The views and opinions contained herein are those of the named author(s) on this page, and may not necessarily represent views expressed or reflected in other Schroders communications, strategies or funds.
This document is intended to be for information purposes only and it is not intended as promotional material in any respect. The material is not intended as an offer or solicitation for the purchase or sale of any financial instrument. The material is not intended to provide, and should not be relied on for, accounting, legal or tax advice, or investment recommendations. Information herein is believed to be reliable but Schroder Investment Management Ltd (Schroders) does not warrant its completeness or accuracy.
The data has been sourced by Schroders and should be independently verified before further publication or use. No responsibility can be accepted for error of fact or opinion. This does not exclude or restrict any duty or liability that Schroders has to its customers under the Financial Services and Markets Act 2000 (as amended from time to time) or any other regulatory system. Reliance should not be placed on the views and information in the document when taking individual investment and/or strategic decisions.
Past Performance is not a guide to future performance. The value of investments and the income from them may go down as well as up and investors may not get back the amounts originally invested. Exchange rate changes may cause the value of any overseas investments to rise or fall.
Any sectors, securities, regions or countries shown above are for illustrative purposes only and are not to be considered a recommendation to buy or sell.
The forecasts included should not be relied upon, are not guaranteed and are provided only as at the date of issue. Our forecasts are based on our own assumptions which may change. Forecasts and assumptions may be affected by external economic or other factors.
Issued by Schroder Unit Trusts Limited, 1 London Wall Place, London EC2Y 5AU. Registered Number 4191730 England. Authorised and regulated by the Financial Conduct Authority.
Leave a Reply
You must be logged in to post a comment.