Sep
2020
Is QQQ All You Need To Do?
DIY Investor
11 September 2020
 QQQ is the ticker for the most popular Nasdaq 100 ETF in the US. With $135bn in assets, it’s about five times the size of Fundsmith Equity, the UK’s largest fund. And it’s beaten pretty much every single UK investment trust and open-ended fund over the last decade.
What’s in it?
QQQ consists of the 100 largest US and international non-financial companies listed on Nasdaq as measured by market cap.
Apple, which you may have heard of, is the largest company at $2 trillion. At the other end, Western Digital is the smallest at $10bn.
Alphabet, Fox, and Liberty Global each have two classes of shares, so it has 103 separate constituents right now.
Information Technology makes up about 50% of the index, with communications (20%), consumer discretionary (17%), and healthcare (7%) accounting for most of the remainder.
The international (i.e. non-US) element only makes up about 2.5% of QQQ right now.
China represents about half of that, with companies such as JD.com, NetEase, Baidu, Pinduoduo, and Trip.com. But there’s no Tencent or Alibaba.
Other non-US companies include MercadoLibre (Argentina), ASML (Netherlands), and CheckPoint (Israel).
There are also a few US names included that you might not think of as typical Nasdaq companies, such as PepsiCo, Costco, Kraft Heinz, Walgreens Boots Alliance, and Marriott International.
How’s it done?
As an index, the Nasdaq 100 has been around since 1985 but QQQ was launched in March 1999.
There’s a UK equivalent, with the ticker of CNDX, that was launched in early 2010 and has around £5bn in assets.
Over the last ten years, CNDX is up some 740%, which translates to 23.5% a year in sterling terms.
However, since QQQ launched in 1999, its total gain is very roughly the same. That reduces its annualised performance to about 10.5%, again in sterling terms.
The flat performance overall in the 2000s hides a very rocky ride. You can find charts online but they don’t do the story justice:
- in a flying start, the fund more than doubled in its first year;
- it then lost 83% (not a typo) over the next two and a half years;
- five years later, in September 2007, it was back to its launch price;
- before getting cut in half by the financial crisis in 2008/09; and
- it’s up nearly 1,200% since March 2009.
Nasdaq 100 vs the world
Here’s a chart showing how various UK, US, and global trackers have done over the last decade.
From top to bottom we have trackers following the Nasdaq 100, S&P 500, MSCI World, FTSE 250, and FTSE 100.
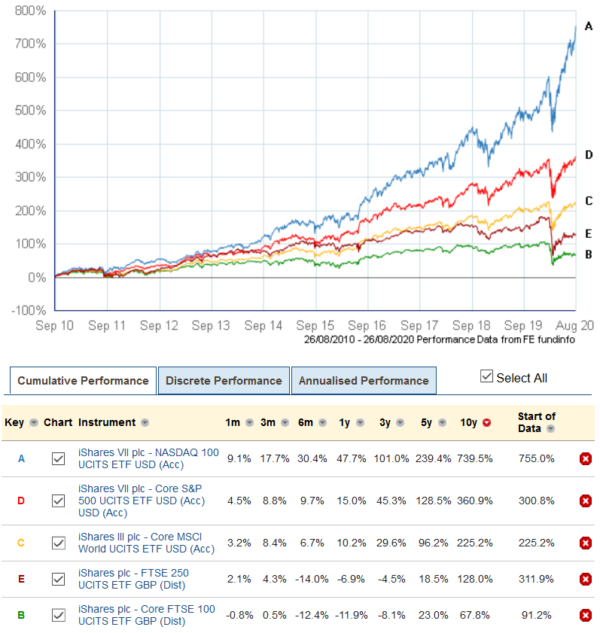
The difference is striking although it probably won’t be a surprise to most investors.
I was a fairly early convert to passive investing, owning the iShares FTSE 100 ETF from 2001 through to 2007, plus a European tracker for part of that time.
Let’s say I’m glad I sold out and put my cash elsewhere. Over the last 10 years, the FTSE 100 ETF has posted a feeble return of 68% (which is mostly reinvested dividends).
I remember FTSE 250 trackers being popular back in the day and taking this slightly more risky UK approach would have nearly doubled your return over the last decade to 128%.
The FTSE 250 even matched the performance of the US market from 2010-2015. More recently, it has struggled massively, though, and over the last five years, the FTSE 250 (up 19%) has even underperformed the sickly FTSE 100 (up 23%).
In 2013, I returned to the world of passive investing with Vanguard’s VWRL and that’s served me pretty well.
Taking a more global approach with your trackers has certainly paid off over the last 10 years. The chart above shows a different global ETF, but your gains would have been a highly respectable 225%.
Doubling down on the US
But concentrating on the US market would have obviously been even better.
The S&P 500 ETF would have seen your money grow by 361%.
Concentrating further still on the Nasdaq 100 takes your gain to 740%.
2020 has been perhaps the most remarkable year of all. The P/E ratio for the Nasdaq 100 has risen from 25 to 35, which is reportedly its highest level since at least 2004.
QQQ is up 37% on the year and 71% from its low point in March.
Behold, the magical power of hindsight!
The Big Five
Much has been made of how the five big technology stocks have driven the US market forward in recent years.
Very roughly, over the last decade, Amazon is up 25-fold, Apple and Microsoft are up 10-fold, and Facebook (since listing in 2012) and Alphabet are up 8-fold.
Here’s how their weightings vary across these various index-tracking ETFs right now:
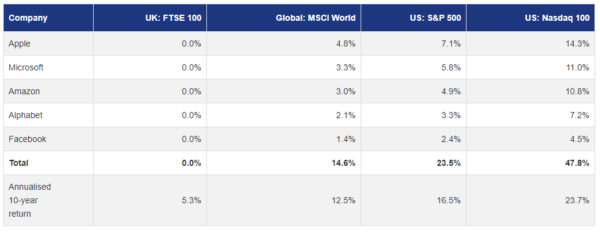
I find this an interesting way to think about how much exposure you want to these companies.
15% via a developed-world global tracker actually seems a bit on the low side to me.
And if you have a whole-world global tracker like VWRL, that also includes emerging markets, you’re probably looking at 11-12%.
Nearly 24% in an S&P 500 doesn’t sound too unreasonable although it’s getting a little spicy for my liking. It’s effectively a 5% average position size.
But I have to admit the Nasdaq 100 ETF gives me a little of the heebie-jeebies, with nearly half the fund in these five businesses, not to mention 3.2% in Tesla.
Over the last decade, though, that’s exactly where you would have wanted to be invested.
My near hit
As an aside, as this whole article is a bit of a departure from my usual pieces, I actually came very close to buying Amazon in 2011.
I was looking to broaden my investing horizons away from the UK with some ‘quality’ US companies. Amazon, Costco, and Berkshire Hathaway ended up on my shortlist.
Of course, I ended up buying Berkshire Hathaway, holding it until 2018. At one stage, I think it was 7-8% of my portfolio.
It did well, roughly trebling in dollar terms, with some weakness in sterling over that time juicing my gains a little further.
Costco would have done even better, up around 5 times before the sterling kicker.
As for Amazon, the share price then of $180 will probably be seared upon my brain forever.
It would almost be a 20-bagger by now and as it cleared $1,000, $2,000, and then $3,000, I get ever more painful reminders.
Whether I would still be holding is debatable of course. I’m sure I would have top-sliced it many times over the years.
That’s more than enough self-pity, so let’s move on!
Investment trusts vs QQQ
It’s very humbling to compare the investment trust sector to the Nasdaq 100.
There are around 270 trusts that have a 10-year record on the AIC’s interactive statistics page.
Only three of them have bested the QQQ.
Just three.
Scottish Mortgage (848%), Allianz Technology (820%), and Biotech Growth (757%) are that trio.
All three have seen their discounts narrow over the last decade so, on a net asset value basis, Allianz is neck and neck and only Scottish Mortgage can claim victory.
Both Allianz and its larger rival, Polar Capital Technology, are ahead of their benchmark but they pit themselves against the Dow Jones Global Technology index rather than the Nasdaq 100. The former excludes Amazon, making it a slightly easier comparator over the last decade.
For open-ended funds, the results are even worse. Only three out of 1,896 beat QQQ, namely Morgan Stanley US Growth, Baillie Gifford American, and Legg Mason Japan Equity.
There are about 20 ETFs out of 1,300 that have done better, although they all seem to either be leveraged or focused on very niche sectors.
Investing is so hard
Amazingly, just a handful of UK-listed trust, funds, and ETFs have beaten what is a pretty mainstream index over the last decade.
The Nasdaq 100 was worth just under $10 trillion at the start of the year. It’s probably worth around $14 trillion now.
The FTSE All-Share is worth just $2.5 trillion, so it’s about the same as Apple and Tesla combined.
Many market pundits have highlighted why it’s been so hard to beat the Nasdaq in recent years. It’s simply because the largest stocks have all performed spectacularly well.
Not only have the current top five gone up at least eightfold, but the rest of the top ten (Tesla, NVIDIA, PayPal, Adobe, and Netflix) have done even better.
Ye olde QQQ
Let’s look back 10 years and see what was in QQQ back then. This is as of September 2010:
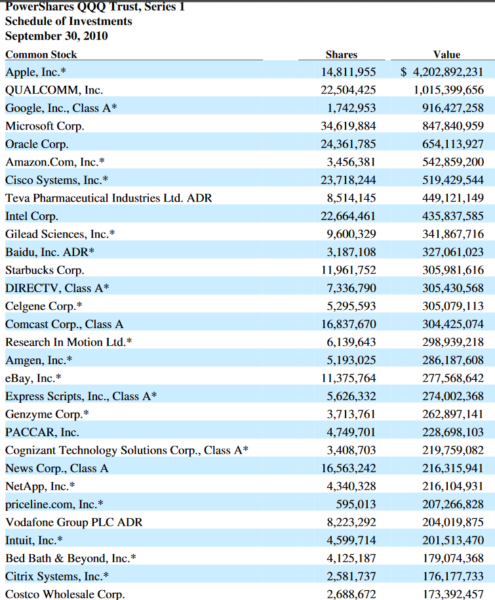
QQQ had $21 billion in assets, so Apple looks to have represented 20% of the fund, far more than the 14% it does today.
QUALCOMM was 5% and is now just 1.1%, even though its share price has risen 150%.
Alphabet (then just Google), Microsoft, and Amazon were all in the top six holdings.
So although the Nasdaq 100 looks very concentrated now, it seems that’s not uncommon. The same top five we have now accounted for a third of QQQ back in 2010.
Going back even further to March 1999 paints a similar picture:
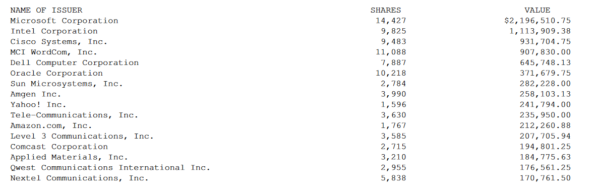
The fund had around $14.5 billion in assets at this point so Microsoft represented 15% and the top five were 35%.
Amazon was 1.5% even then but Apple was just 0.7%. Google and Facebook didn’t even exist.
So… what happens now?
I’d say I’ve generally been a cautious investor over the last 25 years.
And I’ve got to the age and portfolio size where a little less volatility certainly eases the nerves.
What’s more, my new contributions are now pretty small relative to my overall holdings, so it’s harder to repair any damage.
But I’ve also seen the way the world has become increasingly digital and felt the need to shift my portfolio accordingly, albeit at my usual sloth-like pace.
I’ve been thinking tech trusts for a while now but perhaps a little QQQ on the side might make sense as well.
Of course, it’s hard to believe that we’ll have another decade like the 2010s. Surely the top five can’t go up tenfold a second time resulting in multiple companies valued at $10 trillion-plus come 2030?
It’s important to remember that QQQ took until 2010 to leave its 1999 launch price behind. And the peak in March 2000 wasn’t surpassed for 16 years.
But I reckon the excess of those early years in 1999/2000 far exceeded what we are seeing today, making a repeat of such a period of very low returns a more remote possibility (yes, I’ve surely put my foot in it there).
Instead, I suspect regulatory pressures and the continuing rise of China will play their part and mean the gains over the rest of the 2020s are much more moderate.
I would certainly be surprised if so few trusts, open-ended funds, and ETFs beat the Nasdaq 100 over the next decade.
We could also see a repeat of the 2000s where emerging markets massively outperformed the US, the reverse of what we saw in the 2010s.
But given the choice between the likes of Apple, Amazon, and Microsoft and the largest companies in the FTSE 100, the former group still looks way more appealing.
Please note that I may own some of the investments mentioned above. You can see my current holdings on my portfolio page and the index page summarises my posts by category. Nothing in this article or on this website should be regarded as a buy or sell recommendation as this site is not authorised to give financial advice. I’m just a random person writing a blog in his spare time. Always do your own research and seek financial advice if necessary!
Click to visit:
![]()
Leave a Reply
You must be logged in to post a comment.