May
2020
Investment Trusts on Solid Ground
DIY Investor
3 May 2020

To those who regularly invest in investment trusts, discounts can often be part of the opportunity. But to others, discounts are an extra complication, not to mention an extra risk.
The last six weeks has probably strengthened the prejudices of both sides on the topic. The recent bout of volatility has – in our opinion – more clearly exposed both the advantages and the disadvantages of investment trusts.
Our perspective is that discounts are like a drunk friend. They are fun to have around, but at times they let you down, often when it matters most.
Ultimately, the investment trust sector is defined by its discounts. The NAV is what the manager delivers, which is the reason why most of our research is focussed on the NAV.
‘the investment trust sector is defined by its discounts’
Whereas the share price return reflects the NAV with an accelerant (or detractor) – represented by the change in discount over the respective holding period.
Why discounts narrow or widen is a matter of continuing debate and, in most cases, comes down to very specific factors applicable to each trust.
We would argue that – with the exception of very broad patterns or trends – past movements in discounts are significantly less repeatable than past NAV performance.
Fundamentally this is why we believe it is more helpful to use historic investment trust NAV returns as a prism through which to judge the performance characteristics of a trust, rather than historic share price returns.
On the other hand, there are ways to incorporate discount analysis into an evaluation of the opportunity presented by an investment trust at any given point in time. We feel that understanding the historic volatility of the discount is fundamental to the task of analysing a trust’s discount, and of defining factors that will influence it in the future.
In this article we attempt to quantify the reasons for discount volatility, and point to trusts which offer significantly less discount downside from the current level.
Glass half empty…
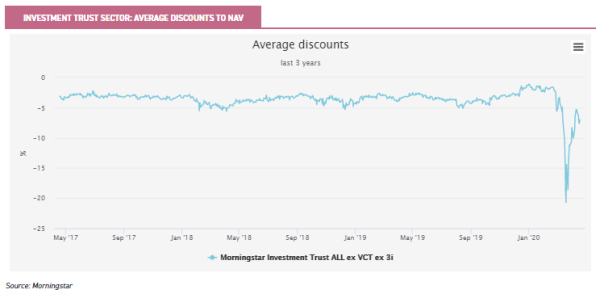
Discounts do tend to widen when markets struggle, as is illustrated in the graph below. Over 2019 average discounts – which were already narrow – narrowed further still.
Then as market confidence started to falter and NAVs started to fall in Q1 2020, discounts widened precipitously and exacerbated losses for investors.
Aside from the fact that open ended funds offer continuous liquidity – which admittedly is offset by the fact they also freeze redemptions at times – the tendency of discounts to balloon during a crisis is unarguably a drawback for the closed ended structure compared with the open-ended structure.
A topical example is Perpetual Income & Growth. The trust saw its NAV underperform the FTSE All Share by around 10% over the calendar year to the low point on 23 March 2020: according to Morningstar the NAV return was -44.4% vs -34.5% for the index.
However, the discount widened to a point where the share price return over the same period was -51.7%; a near doubling of the NAV underperformance relative to the index. This was clearly painful for investors, who took fright and jumped ship.
‘This was clearly painful for investors, who took fright and jumped ship’
The discount has now recovered to the point where the share price and NAV returns are now very similar (c.-34% as of 23 April). This is the main drawback for investors – rapid falls in markets tend to result in discounts widening over the short term.
And perhaps more importantly, as is the case this time, discounts don’t always narrow back to previous levels quickly. BH Global (BHGG) saw its discount actually widen during the crisis, despite being, in NAV terms, the second best performer in the entire closed-end fund sector over Q1 2020 (second only to sister BH Macro).
Perplexingly, it remains at a wider discount than at almost any time over its history. Over the past year the average discount has been well inside 5% and at times has traded very close to NAV.
However, over the past month the discount has widened significantly and at 12% has a Z-score of -1.9. Clearly the share price returns would have been strong, even if the discount had merely remained constant. As it was, the share price returns were only a proportion of the outperformance of equity markets delivered by the managers over this period.
…and half full
The experience of discounts widening out in the past month or so will not surprise more experienced investment trust watchers. There are many well-rehearsed advantages of investment trusts during tough times.
Not least that in a market panic, such as we had in March, fund managers can concentrate on the job in hand rather than be a forced seller of their highest quality assets; which is typically the only way to generate liquidity when market activity dries up.
‘many well-rehearsed advantages of investment trusts during tough times’
The lesson to learn, however, is that when discounts are narrow in absolute terms investors should be aware that there are trusts which have characteristics (or mechanisms) which keep discounts from widening materially or for a sustained period. The likely volatility of the discount, rather than its absolute level at any one point, is a key factor to try to determine.
Picking a trust which has a discount more likely to narrow than widen – for whatever reason – has obvious merit.
As such we view the current widening out of discounts as a potential opportunity to access certain investment strategies; namely those which previously – with a share price trading at or near NAV – offered nothing but downside risk in terms of discount. Now the tables have turned and, in some cases, discounts have widened materially.
Volatility of the discount is key risk over short term
In our view, then, the volatility of a trust’s discount is a key factor for investors to be aware of. If a trust’s discount moves around very wildly (i.e. is highly volatile), then this clearly adds considerably to short-term risks.
As was the case with BH Global recently, while a fund-picker might do a very good job selecting a manager who is delivering strong alpha in NAV terms, a large short-term move in the discount might erode much of that good work. After all, it is the price of a trust’s shares that gets reflected in valuations or ‘realisable’ value.
‘the volatility of a trust’s discount is a key factor for investors to be aware of’
We have analysed discounts of the entire investment trust sector over the past year – which we believe is as reasonable a test period as any.
The AIC sectors which have the highest discount volatility on average can be seen in the table below. It is clear that contributors to high discount volatility might include investing in unquoted investments (possibly due to infrequently published NAV) or having more volatile underlying investments (that may have specialist or single sector focus).
One surprising result of this analysis, however, was that income sectors had – on average – higher discount volatility than the ‘non-income’ equivalent for each geographic area. We expected the higher dividend yield to ‘anchor’ the share price, and prevent the discount widening significantly.
Perhaps the unique threat to dividends that the current lockdown presents has had a bigger influence this time around? As we discuss here, we believe investment trusts are likely to weather the income storm well compared to open-ended funds which makes them potentially more attractive to investors seeking an income – particularly if discounts widen materially (creating an opportunity which of course cannot happen among OEICs where discounts do not exist).
AIC Sector
| AIC sector | Average standard deviation of discount % (1 year) |
| Leasing | 15.3 |
| Commodities & Natural Resources | 15.2 |
| Insurance & Reinsurance Strategies | 12.7 |
| Biotechnology & Healthcare | 12.4 |
| Growth Capital | 9.7 |
| Debt – Direct Lending / Structured | 8.4 |
| Private Equity | 8.3 |
| Property (all, direct) | 7.1 |
| Technology & Media | 6.1 |
| Global High Income | 6.0 |
| Asia Pacific | 5.8 |
| Country Specialist: Asia Pacific ex Japan | 5.7 |
| Infrastructure | 5.6 |
| Global Smaller Companies | 5.1 |
| Renewable Energy Infrastructure | 4.7 |
| UK Smaller Companies | 4.7 |
| Hedge Funds | 4.6 |
| Global | 3.9 |
| Global Emerging Markets | 3.7 |
| Flexible Investment | 3.6 |
| UK Equity & Bond Income | 3.5 |
| UK Equity Income | 3.4 |
| European Emerging Markets | 3.1 |
| UK All Companies | 2.9 |
| North American Smaller Companies | 2.8 |
| Japanese Smaller Companies | 2.8 |
| Global Equity Income | 2.6 |
| European Smaller Companies | 2.6 |
| Asia Pacific Income | 2.5 |
| Asia Pacific Smaller Companies | 2.5 |
| Japan | 2.5 |
| North America | 2.4 |
| Europe | 2.1 |
| Liquidity Funds | 0.5 |
We think the table above is helpful. Both in highlighting where the risks might lie (and where opportunities might be found), but also in revealing sectors where there is the least discount risk.
Thorough research and analysis, combined with detailed understanding of the sector in question, has the potential to provide opportunities for picking up trusts on unwarranted discounts.
Sectors where we feel this work is likely to be rewarded over the shorter term include private equity, infrastructure and property; where the difficulties of providing up to date NAVs have likely exacerbated share price falls.
Getting closer to the causes of discount volatility…
The above analysis may provide some hints about where discount opportunities might lie. However, the best way to profit from discounts narrowing is to understand why a discount exists for any particular trust.
‘the best way to profit from discounts narrowing is to understand why a discount exists’
Below we take a number of factors which might individually be contributing factors to a discount, and apply a multi-factor regression analysis to try to assess the degree to which they ultimately explain the discount.
We liken our attempts (possibly…) to the ‘Hitchhiker’s Guide to the Galaxy’, where a supercomputer was built to provide the answer to the Ultimate Question of Life, the Universe, and Everything.
After eons of calculations, the supercomputer gives the answer simply as ‘42’. Unfortunately, we have to report that our analysis concluded with a similarly meaningless number: to statisticians, the R2 of our result was extremely low! And so we wave goodbye to our Nobel Prize (if the AIC were able to make nominations…)!
So what does cause discount volatility?
We believe a number of quantifiable and unquantifiable factors influence a trust’s discount. Of course, at its most basic level a discount is the result of a mismatch between supply and demand for a trust’s shares.
‘at its most basic level a discount is the result of a mismatch between supply and demand for a trust’s shares’
However there is anecdotal evidence that many trusts establish discount ranges, suggesting that ‘market memory’ (if there is such a thing; more likely, the trading activity of market makers) does have an influence.
Stock market sentiment and a trust’s reputation are also key ‘unquantifiables’ which we believe have significant influence on a trust’s discount. Scottish Mortgage and RIT Capital are good examples of trusts that have a strong reputation with professional and retail investors alike, which helps to keep their discount volatility relatively low.
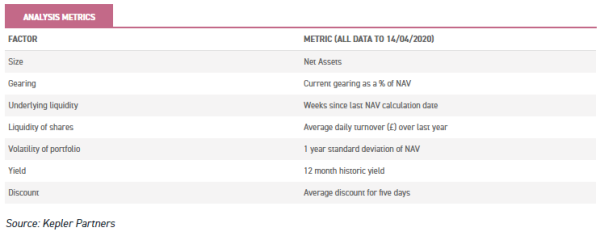
Among the quantifiable influences that affect a trust’s discount, we believe that factors to consider include a trust’s size; its level of gearing; the underlying liquidity of its underlying portfolio; the liquidity of the shares themselves; the volatility of the underlying portfolio; the yield; and the absolute level of the discount (a wider discount potentially meaning that the discount itself is more volatile). The table below illustrates how we quantify these factors in our analysis.
By comparing the discount volatility of each trust with these metrics, we are able to determine some important patterns. In the table below we compare the trusts with the highest decile discount volatility against those with the lowest, as well as the (median) average.
Between the two deciles, lower discount volatility is associated with those trusts which are bigger, and those which have lower gearing, higher volumes of shares traded, more frequent NAV, and lower average discount.
Perhaps contrary to expectations, these ‘low discount volatility’ trusts also had a lower yield and a higher NAV volatility. We believe that, in these two cases, the statistics are skewed by the preponderance of property and leasing trusts in the ‘high discount volatility’ decile.
These asset classes are characterised by relatively low reported NAV volatility (often only quarterly), and a large proportion of their returns comes from income. It is interesting to us that the lowest discount volatility decile has higher gearing than the median.
Perhaps like wine, a little bit of gearing is seen as a good thing, and is only seen as bad when its use starts to become significant?

Aside from specific characteristics of a trust (such as the ones above), boards and managers can also influence the volatility of the discount. A wide range of established tools are available to achieve this, usually known as a ‘discount control mechanism’ (DCM).
Boards may explicitly or implicitly target a maximum discount level or range, and then use buyback or issuance powers to try to maintain the discount or premium within their target.
Where explicitly stated, most trust’s boards also have a ‘normal market conditions’ get-out clause which (rightly, in our view) allows them discretion to not stand in the way of the proverbial charging rhino.
Stating the obvious, the more a board stands by its commitment to a discount target, through thick and thin, the more the market ‘knows’ this, resulting in lower discount volatility.
Our research shows that trusts with DCMs do translate into lower discount volatility than the average, as we demonstrate in the table below. As such, solid DCMs are, in our view, an attractive feature for trusts.
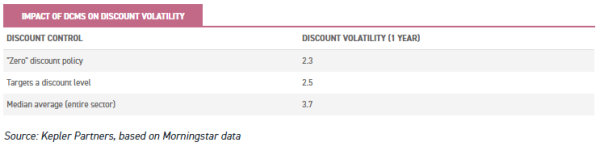
Those trusts with a DCM which targets a maximum discount clearly provide a good marker for long-term investors who hope to benefit from an improvement in appetite for a trust.
Investors who buy shares at or near the board’s discount target know that, over the medium term, this should (although sadly does not always) represent the widest the discount is likely to be. Thereby they are offered potential upside in terms of the discount rating, with less risk on the downside (from the discount widening still further).
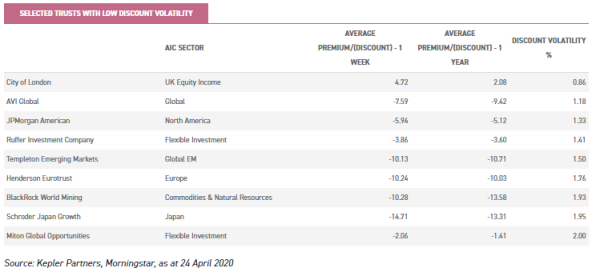
The table below illustrates the trusts which have a discount target, and where the current discount is relative to this target. As mentioned above, most boards have a ‘normal market conditions’ get-out clause, which may explains those trusts where the targets appear to have been exceeded.
Trusts that currently have meaningful discounts near the board’s target include Baring Emerging Europe, BMO Global Smaller Companies, Invesco Asia, JPMorgan Emerging Markets, and Scottish Investment Trust.
trusts with discount targets
| average discount last month | average discount past week | discount target | last week exceeded target by | discount volatility (1 year) | |
| Aberdeen Asian Income | -11.1 | -11.5 | -5.0 | -6 | 1.6 |
| Aberdeen Latin American | -16.5 | -15.9 | -5.0 | -11 | 2.2 |
| Alliance Trust | -6.9 | -4.4 | -4.8 | – | 1.7 |
| Allianz Technology Trust | -0.5 | 1.2 | -7.0 | – | 2.9 |
| AVI Japan Opportunity | 1.7 | -0.1 | -5.0 | – | 2.6 |
| Baring Emerging Europe | -13.8 | -11.2 | -12.0 | – | 2.7 |
| Biotech Growth | -10.6 | -6.9 | -4.0 | -3 | 2.0 |
| BMO Commercial Property | -45.3 | -46.7 | -5.0 | -42 | 10.7 |
| BMO Global Smaller Cos | -11.7 | -7.6 | -5.0 | -3 | 2.9 |
| BMO UK High Income | -11.5 | -10.5 | -5.0 | -6 | 2.0 |
| European Assets | -10.3 | -9.1 | -5.0 | -4 | 2.3 |
| Fidelity Special Values | 0.1 | -1.2 | -10.0 | – | 1.8 |
| Finsbury Growth & Income | 0.4 | 0.6 | -5.0 | – | 1.3 |
| Invesco Asia | -10.3 | -7.3 | -10.0 | – | 1.6 |
| JPM Asia Growth & Income | -3.0 | -3.5 | -10.0 | – | 2.7 |
| JPM Claverhouse | 0.4 | 0.7 | -5.0 | – | 2.2 |
| JPM Emerging Markets | -9.0 | -9.3 | -10.0 | – | 1.6 |
| JPM European Growth | -14.7 | -14.6 | -10.0 | -5 | 1.8 |
| JPM European Income | -12.6 | -9.8 | -10.0 | – | 2.4 |
| JPM Global Growth & Income | 1.9 | 3.2 | -5.0 | – | 2.2 |
| JPM Russian Securities | -13.0 | -11.9 | -1.0 | -2 | 2.2 |
| Jupiter US Smaller Cos | -13.7 | -12.3 | -10.0 | -2 | 2.2 |
| Montanaro European Smaller | -9.8 | -10.0 | -10.0 | – | 3.6 |
| North American Income | -5.6 | -3.1 | -5.0 | – | 2.3 |
| Schroder Oriental Income | -1.9 | -4.6 | -5.0 | – | 2.5 |
| Scottish Investment Trust | -13.0 | -10.5 | -9.0 | -1 | 2.5 |
| Standard Life UK Smaller Cos | -4.7 | -4.4 | -5.0 | – | 3.1 |
| Witan | -4.1 | -2.5 | -10.0 | – | 1.7 |
| Worldwide | -0.1 | 1.4 | -6.0 | – | 2.2 |
| AVERAGE | -8.6 | -7.6 | -7.2 | -6.6 | 2.5 |
Over time – and perhaps a topic for future analysis – one might expect that the more solid the commitment, the less stock a board will have to buy back over the long term.
Some trusts have what we term a ‘zero discount policy’, which we define as aiming to keep the share price as close to the NAV as possible (within a tolerable spread of 2%). In our view, having a very tight discount control mechanism is especially helpful if the trust in question is serving a particular function within a portfolio: such as a diversifier, or helping to protect the downside.
The experience of trusts such as Personal Assets (which was the first trust to have an explicit zero discount policy), and more latterly the likes of Troy Income & Growth and Mid Wynd International, have shown the validity of this approach.
‘the trust acts as its own market maker – issuing or buying back stock when the market doesn’t’
Effectively in these cases the trust acts as its own market maker – issuing or buying back stock when the market doesn’t. In the case of Mid Wynd, in 2014 the board had to buy back 14.7% of the trust’s shares in issue, in order to correct an imbalance between sellers and buyers.
Taking the medicine early on, when Artemis was awarded the mandate to run the trust, meant that the Mid Wynd board has been able to subsequently capitalise on the managers’ good performance and subsequently issue shares, thereby growing the asset base.
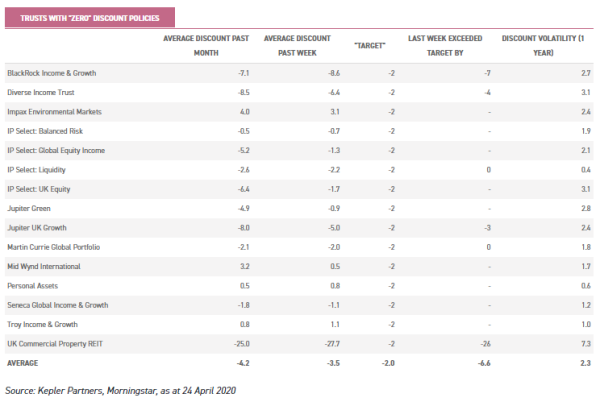
Based on information from JPMorgan Cazenove, we would consider 12 trusts to have zero discount targets (defining Invesco Perpetual Select’s share classes as one).
The fact that some of these trusts currently have discounts wider than targeted illustrates that these ‘zero’ discount policies are not hard and fast, and that each board takes a different interpretation of how tightly they will apply their own rules.
Clearly, boards need to have a view of the wider picture. So where a trust is sub-scale, being too rigid on buybacks could force it into a terminal decline, which may not be in the interests of all shareholders. As proof of the effectiveness of the zero discount targets, the discount volatility of this group of trusts is significantly below the wider peer group.
Trusts which do not have explicit DCMs, but which do have relatively low discount volatility, might also appear appealing to investors. As we mention above, trusts can establish trading patterns which may or may not persist.
However, a trust which trades on a wide but consistent discount offers investors a potentially interesting long-term opportunity.
If the discount remains at its current level over the long term, then investors will achieve a return very similar to the NAV. However, if circumstances conspire that the discount narrows, the shares will outperform.
‘a trust which trades on a wide but consistent discount offers investors a potentially interesting long-term opportunity’
Among those trusts with low discount volatility, some boards, such as Ruffer Investment Company, have only implicit discount control mechanisms. This means that the board is only likely – but is not obliged – to intervene if the discount is perceived as excessively wide. Others, such as the board of JPMorgan American (JAM), have committed to buy shares back at anything more than a ‘small discount to NAV’.
With its very low OCF (estimated at 0.33%) and low discount volatility, shareholders in JAM are likely to experience returns very similar to that of the underlying portfolio.
Should the current discount of around 5% narrow in any meaningful way, this will translate into enhanced returns at a share price level. Other trusts, such as BlackRock World Mining, have buyback powers and use them sporadically. In our view, this is likely to help limit the downside, but the trust’s high dividend yield (7.1% on a historic basis) is also likely to be helping prevent even further widening of the discount.
Conclusion
In our view, being subject to a widening discount is significantly better than being locked into a fund and unable to redeem your investment. However, the experience of the last month or so may have tempered some investors’ enthusiasm for the investment trust sector.
We take the opposite view – that discount risk can be managed by understanding the likely discount volatility. As we illustrate, some sectors and characteristics make trusts more or less prone to discounts gapping out.
‘discount risk can be managed by understanding the likely discount volatility’
The experience of the last quarter actually provides an excellent refresher on the risks inherent in discounts widening when market sentiment turns.
Those who hope to avoid nasty surprises in the future now have recent data points which should enable them to steer clear of future disappointments in discount terms. To those who are happy to embrace discount volatility risk, we hope we have illustrated the potential opportunities available.
For some, discount volatility is a hurdle that will never be surpassed. To us, however, it is a valuable source of extra potential returns.

Past performance is not a reliable indicator of future results. The value of investments can fall as well as rise and you may get back less than you invested when you decide to sell your investments. It is strongly recommended that Independent financial advice should be taken before entering into any financial transaction.
The information provided on this website is not intended for distribution to, or use by, any person or entity in any jurisdiction or country where such distribution or use would be contrary to law or regulation or which would subject Kepler Partners LLP to any registration requirement within such jurisdiction or country. In particular, this website is exclusively for non-US Persons. Persons who access this information are required to inform themselves and to comply with any such restrictions.
The information contained in this website is not intended to constitute, and should not be construed as, investment advice. No representation or warranty, express or implied, is given by any person as to the accuracy or completeness of the information and no responsibility or liability is accepted for the accuracy or sufficiency of any of the information, for any errors, omissions or misstatements, negligent or otherwise. Any views and opinions, whilst given in good faith, are subject to change without notice.
This is not an official confirmation of terms and is not a recommendation, offer or solicitation to buy or sell or take any action in relation to any investment mentioned herein. Any prices or quotations contained herein are indicative only.
Kepler Partners LLP (including its partners, employees and representatives) or a connected person may have positions in or options on the securities detailed in this report, and may buy, sell or offer to purchase or sell such securities from time to time, but will at all times be subject to restrictions imposed by the firm’s internal rules. A copy of the firm’s Conflict of Interest policy is available on request.
Leave a Reply
You must be logged in to post a comment.