Aug
2024
Investment Trusts: Price matters, or does it?
DIY Investor
21 August 2024
NAVs and share price histories both tell a tale, but we think the former has far more value as an indicator than the latter – by William Heathcote-Amory
Oscar Wilde’s Lord Darlington described a cynic as “a man who knows the price of everything, and the value of nothing” and at times like this, when discount volatility is at its most extreme, investors would do well to bear this warning against judging an investment trust on the basis of price history, as opposed to net asset value, in mind.
The investment trust sector is defined by its discounts. Ultimately discounts are a necessary effect of the key differentiator between investment trusts and open ended funds: namely liquidity.
‘The investment trust sector is defined by its discounts’
With open ended funds – in normal market conditions at least – investors are offered daily liquidity in their investment should they want it.
In truth this isn’t very different from investment trusts, although of course there are nuances at the margin.
The problem comes, however, when markets are volatile, which is usually when redemptions tend to spike.
At these times managers of open ended funds can become forced sellers of their highest quality assets to provide the necessary liquidity. This response is sometimes the only way to generate cash for redemptions when market activity dries up.
‘Discounts typically widen out during periods of market volatility’
By contrast investment trust managers have a fixed pool of capital. They do not need to pay any attention to redemptions or subscription flows, and can instead concentrate on the job in hand: managing a portfolio to generate the best returns they can.
When the sea becomes stormy, the pressure release valve for investors wanting to jump ship is that the share price may not track the NAV.
Discounts typically widen out during periods of market volatility, and this year has proved no exception, as the graph below illustrates.
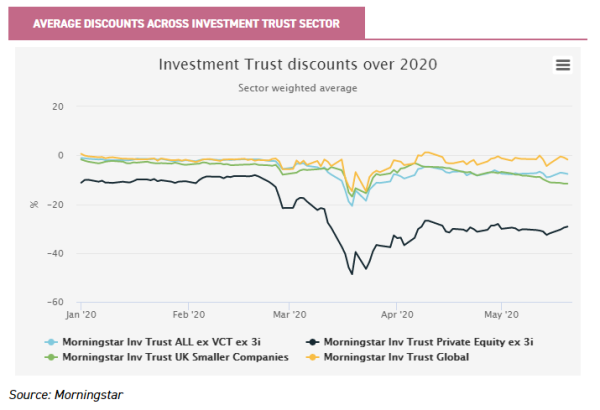
The graph above shows various sectors, some of which have been hit harder than others in terms of discounts widening.
As one can see from the graph, generally, the less liquid the underlying investment within a trust, the more a discount might be expected to widen in a stress scenario.
Discounts are also influenced by a number of other different variables, as we discuss in detail in this article.
These variables include: past performance, the trust’s size, its level of gearing, the liquidity of the shares themselves, the volatility of the underlying portfolio, and the yield.
‘a discount is driven by minute-by-minute changes in the demand for and supply of shares’
Each of these factors will be considered a more important influence by investors at different stages in the cycle. And most importantly – other than the broad pattern – history is unlikely to repeat itself in terms of discounts.
Fundamentally, a discount is driven by minute-by-minute changes in the demand for and supply of shares on the stock market.
The result, in our view, is that the share price history of an investment trust is a poor tool for analysing a trust’s performance – either in absolute terms or on a relative basis (i.e. when comparing it to peers or an index).
This situation is unfortunate for investors, because getting access to good quality NAV data for analysis purposes is expensive.
From our perspective, however, the NAV history is crucial information for any investor wishing to appraise how a manager has performed.
After all the NAV is what the manager has more control of and delivers; which is the reason that much of our research is focussed on it. The share price return, by contrast, reflects the NAV with an accelerant (or detractor) – represented by the change in sentiment toward a trust over a particular time period.
‘the NAV history is crucial information for any investor wishing to appraise how a manager has performed’
Why discounts narrow or widen is a matter of continuing debate and, in most cases, comes down to very specific factors applicable to each trust.
We would argue that – with the exception of very broad patterns or trends – past movements in discounts are less likely to repeat themselves than past NAV performance.
In essence this pattern is why we believe it is more helpful to use historic investment trust NAV returns as the prism through which to judge the performance characteristics of a trust, rather than historic share price returns.
On the other hand, there are always ways to incorporate discount analysis into an evaluation of the opportunity presented by an investment trust at any given point in time.
As we highlight in this article, for some trusts – because of their reputation, the actions of their boards, or perhaps some other reason – there may be a good chance that the share price will closely track the NAV.
There are others, however, where we would argue that the opportunity for the discount to narrow is greater than the risk of it widening; and vice versa.
Either way we think the share price is not a useful tool from an analysis perspective.
So whilst past performance is no guide to future performance, we do think that the NAV is a fundamentally useful tool for appraising the historic skill of the manager.
Leave a Reply
You must be logged in to post a comment.