Sep
2022
Investing in Developed Markets (ex US)
DIY Investor
7 September 2022
 Why a Portfolio Tilt?
By historical standards, US Equities have become relatively expensive; while these trends may persist and be justified by low interest rates or/and sectoral composition a marginal tilt is currently a consideration for some of our readers.
At Bankeronwheels.com, we believe in diversified investing; if implementing a tilt can make overall high valuations more bearable so that investors can stick to their long-term strategy, it is a sin worth pursuing.
We think that in investing, perfect is the enemy of good; we can help you select the most diversified and cheapest funds to increase your returns. Let’s see what’s available.
Key Takeaways
- We’ve focused on Developed Countries ex-US, and exclude Emerging Markets
- These comprise mainly (i) Japan (ii) the UK (iii) Continental Europe and (iv) Australia
- As with any active investing, some considerations may not be immediately obvious
- Global revenues may be more subtle to analyze than Market Capitalizations
- Sectors may matter more than countries; a value/growth rotation could have the biggest influence on your returns
- Unlike US investors, Europeans need at least 2 ETFs to gain exposure to these markets because ex-US funds are not easily available in UCITS format
- A European tilt brings mostly the same sectorial benefits as including Asian countries
- I also compare benchmarks for Europe ETFs including Stoxx, MSCI and FTSE Russell Indices
- A second step is to assess certain practical aspects when selecting ETFs including Tax optimization
- Finally, have a look at fees and compare performance!
Step 1 – Choose the Right Benchmark(s)
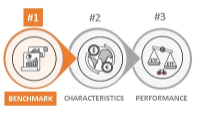 Choosing an Index involves three aspects:
- Market Capitalization is the most direct way of measuring country exposure risk
- Exposure to Economic Activity is the broadest way of assessing the impact of global revenue streams
- Benchmarks coverage varies based on companies’ size and inclusion of the UK
Market Capitalisation
How much exposure will I have to different markets if I buy a Developed Markets ex-US ETF?
World Equities ex-US illustration – Market capitalization for MSCI EAFE
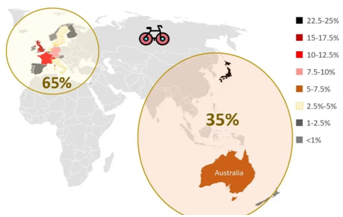
Source: MSCI, Bankeronwheels.com, data as of January 2022
What Regions Are Part Of The MSCI EAFE Index?
Developed Markets ex-US are often called EAFE; the MSCI EAFE Index was created to reflect the performance of predominately mid and large-cap stocks across 21 developed market countries in Europe, Australasia, and the Far East.
Essentially it is the MSCI World Index, stripped out of US Stocks; if this is relatively new, you may want to have a quick look at Equity ETF Benchmarks before digging deeper.
US Investors often use MSCI EAFE to get International exposure. EAFE countries can be divided into two regions:
European Markets – roughly 65% of the overall market capitalization
Asia Pacific Markets – just over a third of the market cap, mostly driven by Japan and Australia
How Much Exposure Will I Have To Different Markets If I Buy A European ETF?
European Equities Illustration – Market Capitalization for EUROSTOXX 600
By investing in European Stocks you cover over 65% of all EAFE countries; the broadest European Indices (EuroStoxx 600 or FTSE Developed Europe) will provide exposure to Western Europe including the UK, which usually represents the largest allocation (between 22.5 and 25%).
Other countries that have a high allocation include France (15-17.5%) and Germany (12.5-15%).
How Much Exposure Will I Have To Different Markets If I Buy A Pacific ETF?
Asian Equities Illustration – Market Capitalization for MSCI Pacific Index
The rest of the EAFE countries are located in Asia; a single ETF tracking all of them is a rare fund.
Such a fund may track the ‘all-in one’ MSCI Pacific Index; this benchmark mainly includes Japan (65-70%) and Australia (20-22.5%). You will also gain marginal exposure to equities listed in Hong Kong (7.5-10%) and Singapore (2.5-5%).
Economic Exposure
So far we have covered the Market Capitalization of European and Asian Developed Markets’ stocks.
However, the real economic exposure of the companies will be different in a couple of ways:
Source of Revenues – As companies become more global they derive their revenues from international markets. Currency diversification will also increase. Compared to US companies, investing in European Stocks means increasing revenue sources from Emerging Markets, too.
Sectoral Exposure – The sectoral mix can be even more impactful than looking at the countries where stocks are listed or derive their revenue from.
What active bets are you implicitly making by investing in ex-US Developed Markets?
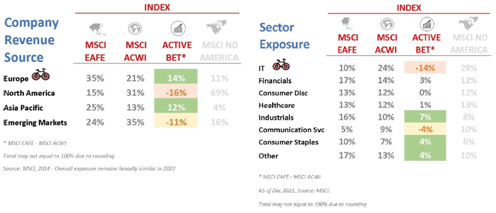
Consider a few facts before investing in an EAFE Fund (comparisons vs a World ETF represented by MSCI ACWI):
- Many European and Asian companies have been at the vanguard of globalization and exhibit considerable diversity in their geographic scope today. It applies across different industries – eg Unilever, Siemens, LVMH or Toyota.
- By reducing your exposure to the US, you will almost equally increase economic exposure to Europe (14%) and Asia (12%). Exposure is defined by company revenue source country.
- It may not be intuitive that exposures increase similarly even though Europe accounts for 65% of the overall market cap. This is because most of Asia Pacific revenues (over 70%) are sourced locally while European companies are more diversified
- Your relative exposure to emerging markets will reduce, albeit Europe and Asia are still relatively more exposed than the US (24% vs. 16%).
- To keep emerging market exposure intact, you will need to add EM ETF to compensate for the over allocation to developed markets.
- The ratio will be around the same as EM’s share in MSCI ACWI since EMs derive almost all their revenues locally (over 80%).
- Most importantly, you will make sectorial bets including being relatively underweight (i) IT Stocksincluding Apple, Microsoft or Nvidia and (ii) Communication Services including Alphabet, Facebook or Netflix
What active bets are you implicitly making by investing In European markets?
- European companies have the largest exposure to emerging economies amongst developed countries.
- The relative reduction in EM exposure is thus lower (-8%) than for the entire EAFE (-11%)
- By investing only in Europe (no Japan, Australia, Hong Kong and Singapore exposure) your sectorial exposure won’t vary significantly compared to having those countries included.
Picking a Benchmark
ETFs tracking MSCI EAFE Index are the easiest option to invest in all developed markets ex-US; however, these are only available for Europeans investors that qualify as Professional Clients as it relates to MiFID Rules.
Once you qualify you can get access to those ETFs with your broker. Non-professional European Investors can invest in a couple of equivalent funds.
MSCI EAFE ETFs are not available in UCITS format because they are meant for investors that want to control their home country bias; you will find ex-US Funds in the US and ex-UK ETFs in the UK.
As a retail investor, you can invest in a couple of UCITS ETFs that cover the different Markets:
- ETFs tracking European Stocks– provide coverage to most of the developed ex-US Markets; benchmarks’ coverage is detailed below.
- ETFs tracking MSCI Pacific Index– Lyxor provides an ETF tracking the MSCI Pacific Index. However, it is a synthetic ETF and quite expensive (0.45%). Other MSCI Pacific funds exclude Japan. The largest is iShares MSCI Pacific ex-Japan (0.2%) that covers Australia, Hong Kong, Singapore and New Zealand and can be combined with iShares MSCI Japan IMI ETF (0.15%) that also includes small caps.
What Types Of Companies Do European ETFs Cover?
European Equities – Benchmark Coverage
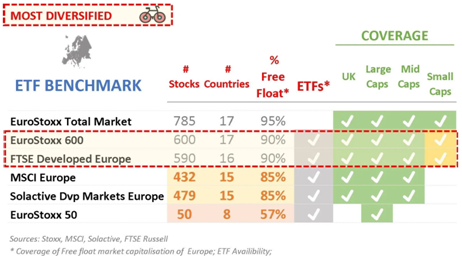
What Are Key Considerations In Choosing A Benchmark?
- A larger Free Float coverage provides you more exposure to smaller and medium companies and ultimately better diversification
- Most benchmarks include the UK except the EuroStoxx 50 that only includes Eurozone countries and is fairly concentrated in Large Caps
 Once you have selected a benchmark you can drill down into fund characteristics.
You can save considerable amounts of money by optimizing taxes and reducing various ETF risks.
What Characteristics Should I Check?
Make sure you understand how to pick the right ETF; we have designed a guide that covers all the main aspects of Equity ETF Selection including understanding of (i) Currency and (ii) Distributing/Accumulating Share Classes or (iii) how to assess critical Fund Size.
What About Taxes?
Here is the potentially tricky part; for a small portfolio, this may not make a big difference but if you have a sizeable allocation, tax leakage may be a problem.
Why?
- EAFE Countries tend to have higher dividend yields (3%) than US companies (1.5%)
- Every time a dividend is paid outside of the country where the company is based you may be taxed. Have a look at how it works.
- European ETFs may not be fully Level 1 tax-efficient. One of our readers, Juan, pointed to the KPMG guide(pg 12) that lists WHT rates in different countries. Some rates may be applied by Irish ETFs or Luxembourg SICAVs on e.g. French Dividends (26.5% rate per KPMG).
- However, ETF providers have not provided clarity on what rates are currently being applied.
- While we have no influence over the rates being applied, knowing it could be helpful in determining the choice of accumulating vs. distributing share classes to optimize taxes in certain situations.
Note that the consistent ETF outperformance vs. benchmarks per below table points to ETFs being overall tax-efficient.
Step 3 – Compare ETF Performance
 Now that you have filtered for a number of candidates, performance is a good final step to select the best ETF.
But remember, the above steps are more important. Tracking Difference doesn’t always guarantee future outperformance.
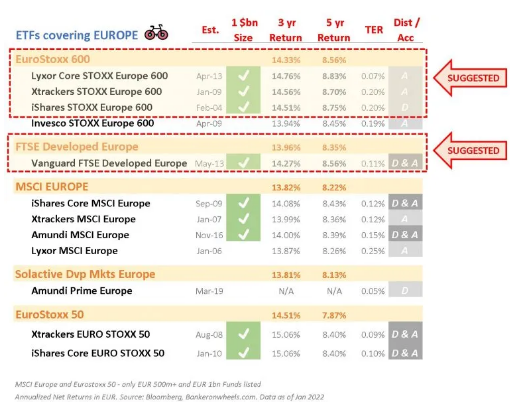
Which ETFs Should I Choose?
Based on your choice of benchmark and characteristics, you can narrow down the selection using TER and 3 and 5-year performances. If choosing the most diversified ETFs:
- Accumulating Share Class – The cheapest and best performing Stoxx 600 Europe ETF is Lyxor Core Stoxx Europe 600(available in EUR/GBP/USD) closely followed by Xtrackers Stoxx Europe 600 (EUR/GBP). Vanguard FTSE Developed Europe is also a cheap alternative.
- Distributing Share Class – iShares Stoxx Europe 600is the only fund tracking Stoxx 600 (only in EUR) while Vanguard FTSE Developed Europe is the cheapest highly diversified distributing fund (EUR/GBP/CHF/USD).
European Equities – ETF Cost and Performance Comparison
Thank you for reading.
Happy Investing and keep’em* rolling !
(* Wheels & Dividends)
Commentary » Exchange traded products Commentary » Exchange traded products Latest » Mutual funds Commentary
Leave a Reply
You must be logged in to post a comment.