Oct
2022
Investing Basics: Tracking your investments with Excel
DIY Investor
26 October 2022
If you are a casual stock trader, there is no need for exclusive tracking programs that charge monthly. That money should go into buying more stocks. Today, we will teach you an easy way to track your investments with a basic program: Excel.
How to Get Stock Price Updates in Excel Automatically
If you think Excel cannot track your investments, think again.
Excel is a fantastic beginner program for recording every stock you purchase. If your portfolio is scattered with multiple stocks, Excel provides an easy-to-use barebone interface, and with basic Excel training, you can stay up-to-date with your investments. Advanced features for stock tracking are seamlessly integrated into Excel.
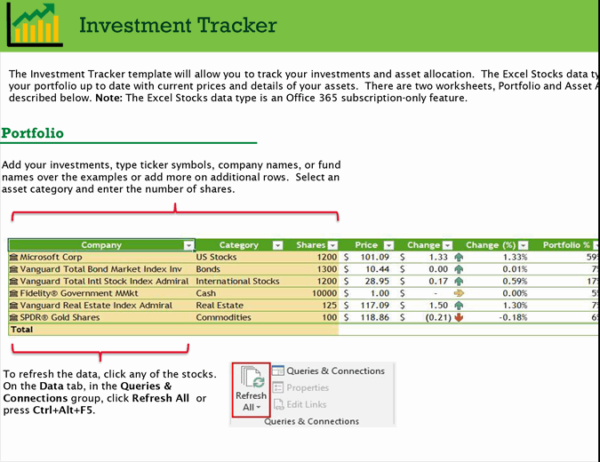
Let’s jump into Excel to track stocks and pull in stock data. Feel free to steal our 3 steps for a free investment tracking tool, or use the official investment tracker template on Excel made by Microsoft.
Step 1: Input Stock Names and Prices
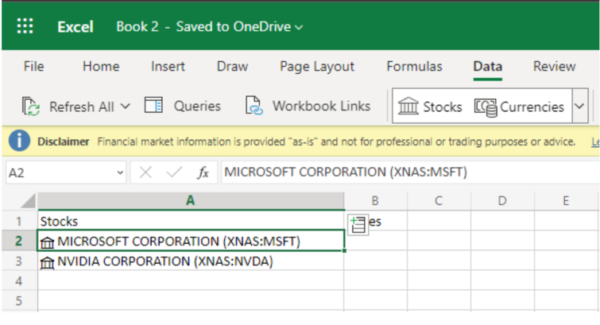
On a blank Excel page, Insert two columns: Stocks and Prices. Below the Stocks column, enter the ticker symbols of your stocks. For example, we have MSFT for Microsoft and NVDA for Nvidia. After entering the ticker symbols, highlight them and click on the tab Data on top. Then, click on the Stocks icon (with a house logo).
You should see the ticker symbols change into full company names, and a house logo appears in front of each name, like so.
Click on each house name, and a tab will open up. In this tab, you can see every data about the stock you track, typically the price, highs, lows, and last trade time. Go ahead and hover over the price. An icon should pop up. Click on it, and the amount will appear in an adjacent row. This amount is based on real-time and will update as the market updates. There you have it!
Step 2: Input Gain/Loss Percentages
Use the same feature discussed above to gather more details about your investments. For example, hover on Change (%) and click on the icon to input real-time gain/loss percentage. You can use this feature to obtain more information about the stocks you are investing in, such as the industry of the company, the total amount of employees, their headquarters, and market cap.
Step 3: Calculate the Total Value of Purchased Shares
Create two new columns called Shares and Value. You can obtain the number of shares purchased by working with your broker. Using an online broker app will make this information available as you click on the stock. For example, you are buying 3 shares of Microsoft at $242.12/share. Under the Value column, input the following formula: =(the total shares)*(market price). This formula will provide a value you can use to determine if you are gaining or losing capital.
If you invested $700 into Microsoft, and the value comes out to be $726.36, you have earned $26.36. Congratulations on your earnings!
Conclusion
Tracking investments can be straightforward with the right tool. Of course, there are better ways to track your stocks than using Excel, but if you are a trading enthusiast, then Excel is more than sufficient.
Excel allows you to customize how data is presented and which numbers matter to you the most. On top of everything, it is free to use. Did you learn a new way to track your stocks today? Let us know how we can be there for your journey to financial freedom.
Brokers Commentary » Brokers Latest » Commentary » Financial Education » Latest » Take control of your finances commentary
Leave a Reply
You must be logged in to post a comment.