Sep
2021
In at the deep end
DIY Investor
24 September 2021
This is not substantive investment research or a research recommendation, as it does not constitute substantive research or analysis. This material should be considered as general market commentary.
 Does seeking out wider-than-usual discounts help investors systematically outperform in the UK trust space?
Highlander 2: The Quickening was an improvement on the first film in the franchise. Ride the Lightning was and remains superior to Kill ‘Em All. Personal preference is for the Second Punic War over the First. And helium works better than hydrogen as a lifting gas in zeppelins. In this spirit, we thought it might be interesting to have another bite at a cherry ourselves, and revisit and expand our previous research note about discounts and subsequent NAV performance. This time we are looking at the various UK investment trust sectors.

Mr Wilde would never consider us at Kepler Trust Intelligence to be cynics, you would hope. The entire point of maintaining and updating a Discount Opportunities Portfolio is to highlight trusts which we think are inherently undervalued. Yet it is not simply enough to look for a significant discount; qualitative considerations about what might cause the wider market to recognise the value we see in these trusts have to be taken into account too (in much the same way that many of us individually might be financially better off if teetotal, but at what cost?).
We’ve looked below at trusts on a sector basis, aiming to identify whether a wide discount across the sector does lead to higher average NAV returns. We used Z-scores, investigating the relationship between discount and subsequent NAV returns at one or two standard deviations below the rolling 12-month discount.
Whereas in our previous research we found that wider Z-scores had tended to presage stronger periods of returns in sectors including Japan, Asia-Pacific and India, such a relationship is sadly not particularly visible within the various UK equity sectors, as we discuss below. We would suggest that this may reflect particular circumstances surrounding sentiment towards the UK market in recent years, as well as perhaps index composition on a sector basis. It has, however, been very effective within the UK Smaller Companies sector in recent years.
Methodology
Our methodology remains unchanged from our previous research, with a focus on this occasion on the UK equity sectors (UK All Companies, UK Equity Income, UK Smaller Companies). We have looked at the unweighted average of these sectors built up from trusts with sufficient track record to ensure we could generate a long data series without significantly reducing the number of trusts included, as well as at the individual performance of the trusts.
From these data sets, we have looked at the Z-score to evaluate the discount level. To recap, a Z-score is a measure of a specific value’s relationship to a distribution of values. For a discount, it is the current discount minus the average discount, divided by the standard deviation of the data set from which the average is derived, and so is a measure of how far away from the average an individual data point is.
In the context of discounts below, we have calculated rolling 12-month Z-scores from daily data; this looks at how discounts looked on any given day relative to the average of the previous 12 months and the standard deviation of that average. A Z-score of less than -2 implies a very rare and unusual occurrence (in the lowest c. 2.5% of values in the distribution), while a Z-score of -1 would imply the observation is in the lowest 16% of values.
We looked at the 12-month Z-score of the unweighted sector average discount on a given day versus the NAV total returns in the subsequent 12 months. We have then looked to see:
- If the Z-score was less than -2, how did the median subsequent returns on these days compare to the median return from all data points?
- If the Z-score was less than -1, how did the median subsequent returns on these days compare to the median return from all data points?
- In both instances, on what percentage of occasions would investors have subsequently seen returns superior to the median return over all time periods?
In the course of our research, we discovered there had been some sort of referendum in the UK in June 2016, and that there had been fairly notable ructions around sentiment towards the UK market surrounding this. We have separated out the pre- and post-referendum periods to see if there is a discernible difference.
Clearly the exceptional circumstances of 2020 might distort results, so we have also shown in each instance how these return series would have looked at the start of 2020 as well. Using the median rather than the average further allows us to dilute the effect of exceptional events.
UK All Companies
The AIC UK All Companies sector typically houses trusts with an all-cap approach, though there are mid-cap specialists contained therein as well. At the broader sector level, the more ‘core’ nature of many constituent trusts might mean we should reasonably expect sentiment to wax and wane in line with broader UK market sentiment, but also in line with many of the more cyclical and value orientated trades given the sizeable exposure within the UK stockmarket to sectors such as materials, financials and energy. Our analysis suggests at first glance there is no reliable link between wide discounts and subsequent NAV outperformance.
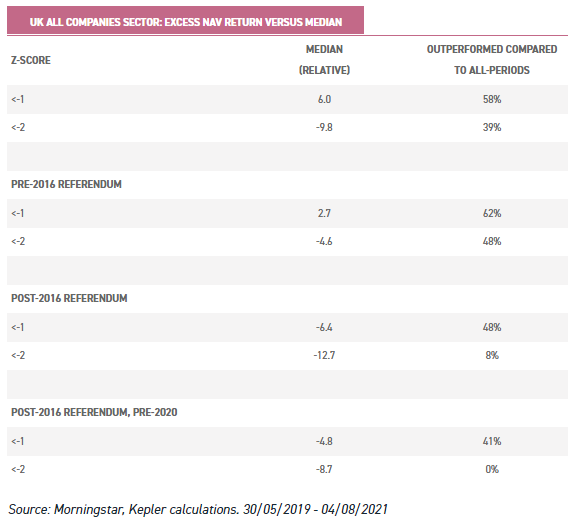
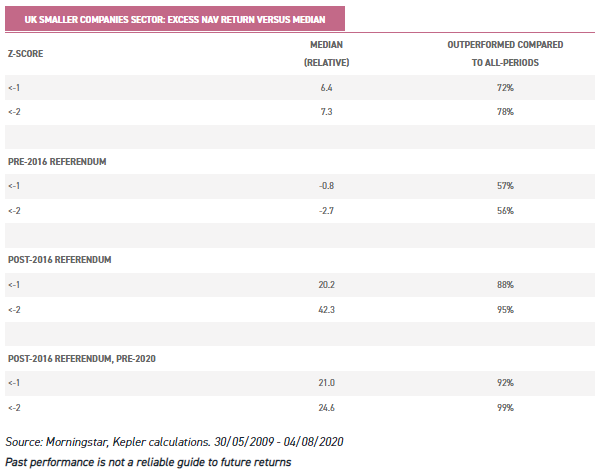
So, from this table, we can see that:
- The median period when the Z-score of the sector (by unweighted average) was less than -1 has outperformed (by c. 6% p.a.).
- Surprisingly, however, this was not true when the Z-score of the sector was less than -2.
- Indeed, buying the sector on a Z-score of less than -2 post-referendum has been a nearly universally weaker time to buy.
- This is not a result of 2020 figures.
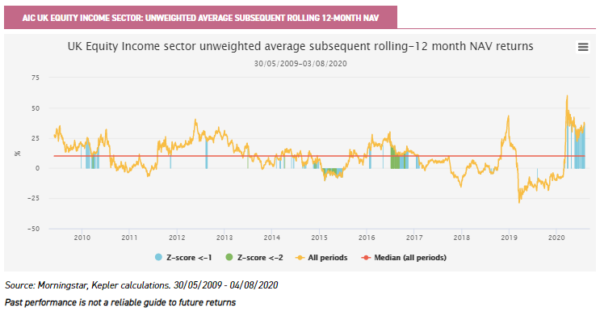
Although we’ve used median figures and looked at figures ex-2020 too, clustering obviously remains a concern. Visually, when we look at the chart below, we can see that perhaps these figures are somewhat misleading. Periods of relatively wide discounts in fact do seem to have tended to subsequently see stronger returns; we can see that periods of subsequently stronger returns have typically seen average Z-scores look notably wider at least initially. The exception which appears to have skewed the figures is a period around the start of 2019, which will have captured the subsequent drawdown of Q1 2020 with little of the recovery experienced.
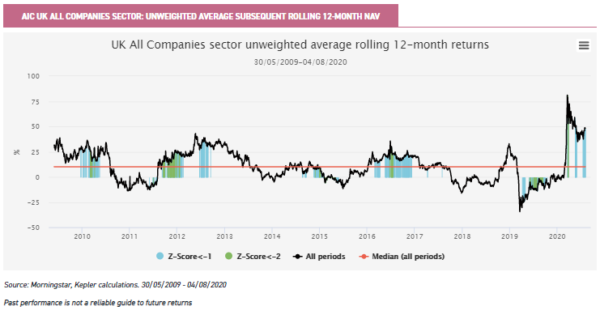
Whilst a solely quantitative interpretation may be that any value offered by the wider sector trading at a notable discount is illusory, we would suggest this might not be the case. Ordinarily, it would seem reasonable to infer a degree of contrariness is warranted with regards UK All Companies allocation on this basis.
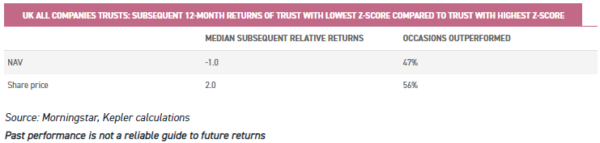
This may be true of the sector, but should investors look to rotate intra-sector to relative discount opportunities? Below we can see the subsequent 12-month NAV and share price returns of the UK All Companies trust with the lowest Z-score on any one day against the trust with the highest Z-score.
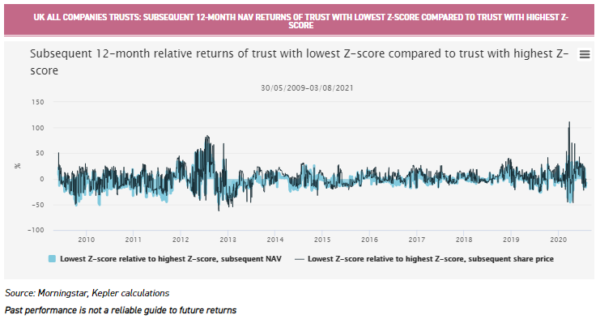
The conclusion as to whether switching has been a good idea is….maybe? On a share price basis, investors have benefitted more often than not, but have typically lagged on an NAV basis. Either way, the figure is hardly decisive in our view, and qualitative considerations should be applied.
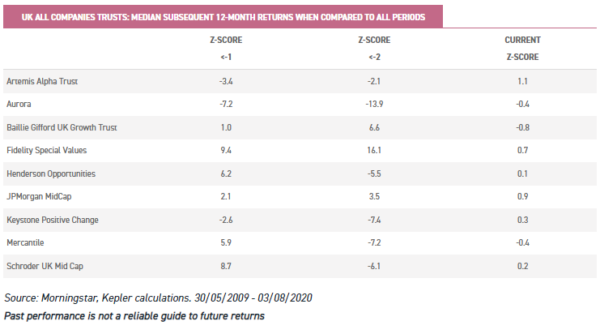
When we look at the trust-specific level within this sector, there is no real clear pattern. In general, trusts have seen stronger NAV returns after their discount has widened, when compared with all time-periods. Trust-specific issues will also have impacted overall returns; Aurora Investment Trust, for instance, underwent a sea-change in management approach with the change in manager in 2016; since this time, it has tended to see slightly stronger returns when the Z-score has been below -1 when compared to all other periods.
Interestingly, the avowedly value-focussed Fidelity Special Values has exhibited strongly superior returns when its own discount has widened, when compared with all other periods. Similarly, JPMorgan MidCap (JMF) has also done well; we covered in our recent research that wider discounts in this trust have tended to coincide with relative outperformance of the market and benchmark too.
UK Equity Income: Down payment blues?
The ability of investment trusts to offset challenges to revenue generation through selective deployment of revenue reserves has been oft-highlighted as one of the fundamental attractions of the structure, thrown into sharp relief by the straitened conditions of 2020. Discounts on income-focussed vehicles offer the ability to generate a premium level of yield above that generated relative to NAV (buying £5 of income for £80 on an NAV of £100 giving a yield of 6.25% to share price, as opposed to 5% to NAV).
It may well be that investors would expect overreactions in equity income products regarding discounts to be more mean reverting, as investors look for opportunities to boost their yield. Alternatively, the need to maintain holdings past ex-dividend dates to ensure payment of income may render this capital more ‘sticky’.
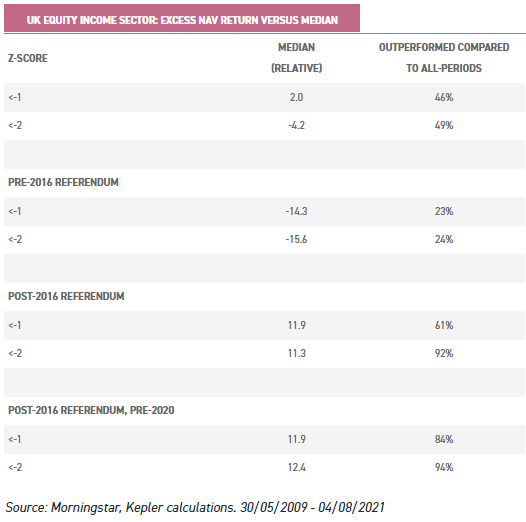
At first glance, the strong outperformance of reversionary tendencies post-referendum may seem skewed by 2020 returns. Whilst from the table above this does not seem to be particularly the case, it does seem undoubtedly clear that strong recent returns from discounted positions have helped.
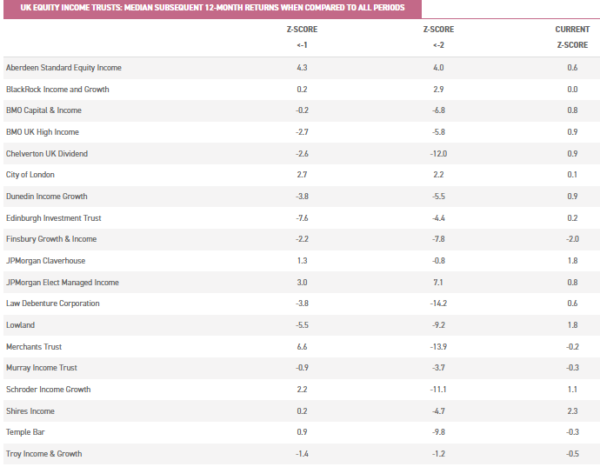
As with the UK All Companies sector, there is no ‘hard and fast’ rule that emerges. On a trust-specific level some of the strategies have evolved complicating the analysis; BMO High Income (BHI) and Dunedin Income Growth (DIG), for instance, are quite different beasts to what they previously were since evolving its strategy in recent years.
UK Smaller Companies: kleine lust
Perhaps with a nominative association that leaves much of the marketplace assuming they are highly sensitive to fluctuations in the domestic economy, smaller companies’ trusts have in recent years demonstrated a fairly unequivocal tendency to outperform in NAV terms subsequent to precisely the times the market believes share prices are too high. This has become notably acute post-referendum, as we can see below, as investors agonised over short-term political newsflow before seemingly rapidly changing their minds
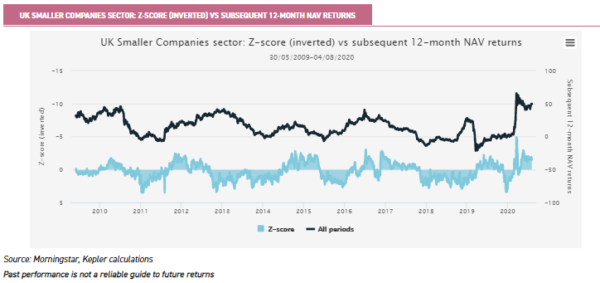
To put this more starkly, we can see below the sector Z-score (inverted) against the subsequent 12-month returns. Where previously little relationship existed, subsequent to 2016 we can see that periods of stronger returns from the sector have tended to coincide with periods where discounts are wide, as measured by the Z-score. Whether this persists, of course, remains to be seen; though not always accepted as such, the political settlement between the UK and EU is now essentially finalised, sentiment surveys show the return of foreign capital to more typical weightings, and such violent rotations in sentiment seem less likely to be repeated going forward. What we would note is the managers in this space repeatedly emphasise the possibility of finding companies with endogenous sources of operational growth, covering styles as diverse as Miton UK MicroCap (MINI) to BlackRock Throgmorton Trust (THRG).
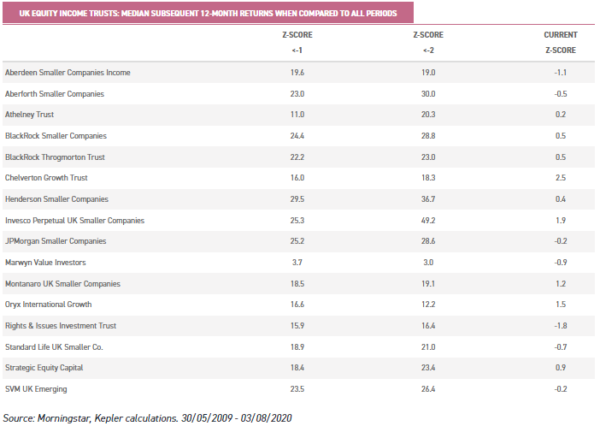
Unsurprisingly, given the strength of the sector average performance differential when trading at a notable discount noted above, this has been broad based. We can see this below, looking again at how the constituent trusts have performed on an NAV basis in the subsequent 12 months when their discounts are elevated on a Z-score basis, as compared with their own performance over other periods. We note with interest that this highlights Aberdeen Smaller Companies Income (ASCI), one of our discount opportunities recommendations, as offering a seemingly attractive entry point at this time.
Conclusion
Domestic and international investors have for a number of years been reacting to developments in the UK political establishment, with even small changes to the perceived direction of political travel often seeing sizeable changes in allocation.
At the broader market level, it has paid well overall to lean into such considerations and seek to buy when trusts are on a wide discount; however, this is skewed by market activity in early 2019. More generally, investors would, we suggest, have been well advised to be aware of political and economic developments and then bet against the market reaction.
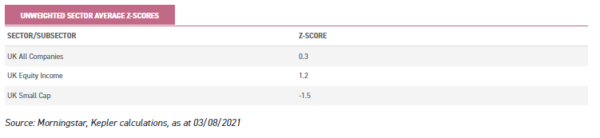
This has been particularly evident in the UK Smaller Companies sector, perhaps as a result of the perceived susceptibility to political developments. Times of falling sentiment reflected in widening discounts have proven effective periods to accumulate holdings. On a sector level the current Z-score makes UK Smaller Companies look interesting in that context, and we previously highlighted here, the potential opportunity.
As ever, however, the need for qualitative input and assessment of potential discount opportunities remains crucial. We continue to look for discounted opportunities at the trust-specific level in our Discounted Opportunities Portfolio.

Past performance is not a reliable indicator of future results. The value of investments can fall as well as rise and you may get back less than you invested when you decide to sell your investments. It is strongly recommended that Independent financial advice should be taken before entering into any financial transaction.
The information provided on this website is not intended for distribution to, or use by, any person or entity in any jurisdiction or country where such distribution or use would be contrary to law or regulation or which would subject Kepler Partners LLP to any registration requirement within such jurisdiction or country. In particular, this website is exclusively for non-US Persons. Persons who access this information are required to inform themselves and to comply with any such restrictions.
The information contained in this website is not intended to constitute, and should not be construed as, investment advice. No representation or warranty, express or implied, is given by any person as to the accuracy or completeness of the information and no responsibility or liability is accepted for the accuracy or sufficiency of any of the information, for any errors, omissions or misstatements, negligent or otherwise. Any views and opinions, whilst given in good faith, are subject to change without notice.
This is not an official confirmation of terms and is not a recommendation, offer or solicitation to buy or sell or take any action in relation to any investment mentioned herein. Any prices or quotations contained herein are indicative only.
Kepler Partners LLP (including its partners, employees and representatives) or a connected person may have positions in or options on the securities detailed in this report, and may buy, sell or offer to purchase or sell such securities from time to time, but will at all times be subject to restrictions imposed by the firm’s internal rules. A copy of the firm’s Conflict of Interest policy is available on request.
PLEASE SEE ALSO OUR TERMS AND CONDITIONS
Kepler Partners LLP is authorised and regulated by the Financial Conduct Authority (FRN 480590), registered in England and Wales at 9/10 Savile Row, London W1S 3PF with registered number OC334771.
Leave a Reply
You must be logged in to post a comment.