Sep
2023
How technology is transforming India’s economy
DIY Investor
10 September 2023
From more efficient tax collection and stock market investing, we examine how technology is helping to boost India’s economic growth – by Jigar Gandhi
India has been using technology to transform its economy, boosting its ability to continue growing faster than other major economies. The country’s use of technology has also had a positive impact on society and helped to reduce emissions. Technology has also changed the way the capital markets function and the opportunities they provide. In this article, we examine some of these recent changes and how these will probably define the future path of the Indian economy and its capital markets.
Banking: The key to financial inclusion and formalisation of the economy
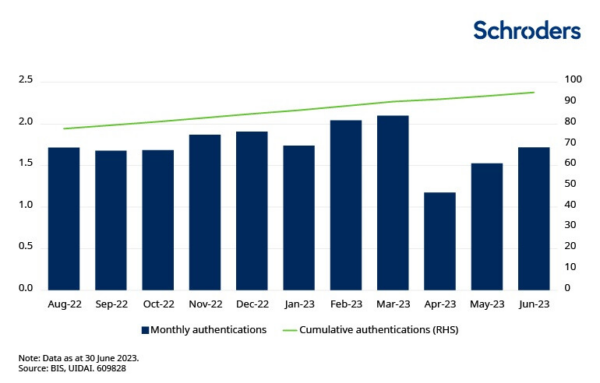
Only one in 25 Indians had formal identification and one in four had a bank account in 2008. India’s unique biometric identity system, Aadhaar, launched in 2010, was the first digital system designed for the specific purpose of authenticating individual identity. More than 1.2 billion Indians now have a unique digital identity, and the system is used to authenticate identity for more than 1.6 billion transactions each month.
The speed of adoption of Aadhaar together with other government initiatives has also led to a sharp increase in the number of bank accounts. According to the Bank for International Settlements (BIS), more than 470 million Indian adults opened a bank account between 2011 and 2017. This increase was also accompanied by an improvement in inclusion. The gender gap – the difference between the shares of men and women with a bank account – fell from 17% in 2011 to 6% in 2017; those in and out of the labour force fell from 18% to 9%; between those with secondary education and those without from 29% to 10%; and between rich and poor from 14% to 5%. The gaps are now all lower than world levels.
The percentage of the Indian population aged 15 years or older with a bank account jumped more than 27% in less than three years (from 53% in 2014 to almost 80% in 2017). BIS estimates that it would have taken 47 years to achieve 80% of adults with a bank account had India solely relied on traditional growth processes. India did it in seven years with the help of technology.
However, this financial inclusion also comes with risks. The risks of fraudulent behaviour and the potential for fraud increases when consumers are less educated and less confident with using technology, A focus on both – pre-emptive fraud detection and consumer education – is therefore necessary. Consumers need to be educated on an ongoing basis, not only in the use and the features of digital financial platforms, but also in how they can protect their personal information.
Connectivity: The key to unlock the potential of the masses
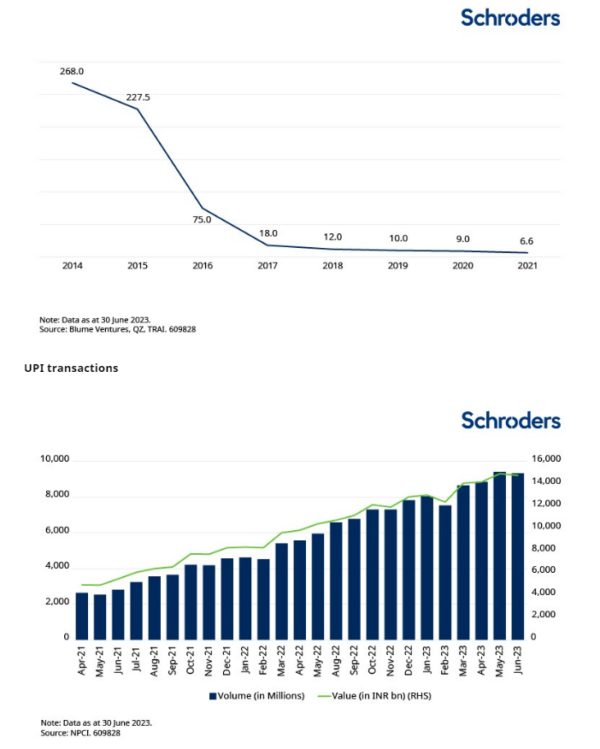
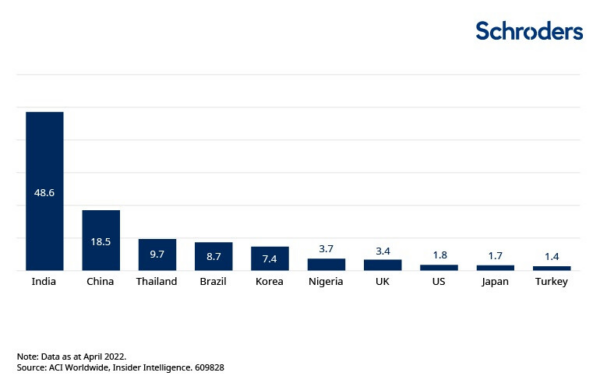
The increase in bank accounts has resulted in a more formal economy and increased the need to smooth payment speeds and processes. The system of physical clearing houses for payment instruments was an impediment to growth and locked capital for corporates for days if not months. The emergence of digital payments, especially the Unified Payment Interface (UPI), since 2016 has helped India achieve the highest volume of digital payments in the world every year since 2019.
The UPI is a unique system that allows interoperability and has transformed India from a cash-focused economy to an instant payment one without disclosing bank details to the counterparty. This has also reduced friction and unlocked working capital for the corporate world. All these digital payments need access to the internet and data is a key enabler. The cost of data in India is one of the cheapest in the world moving from INR 268 (about US$4) in 2014 to INR 6.6 in 2021. This has resulted in mass acceptance and growth in the adoption of internet-enabled phones, a reduction of cash and the ability of the government to pass benefits directly to the end user cutting time, effort, and cost. The ecosystem is now being enhanced to process payments without the internet as well, bringing the lower end of the economic pyramid into the digital payment system.
Cost of 1GB of data (in Indian rupees)
Indirect taxes, logistics and transport: the key to making India a single market
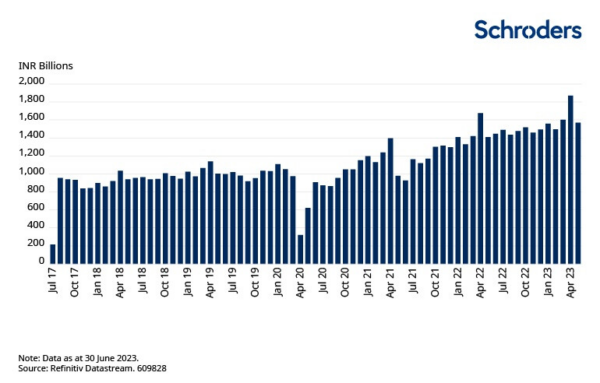
India comprises 28 states and eight union territories. The indirect tax system in the country was state driven prior to 2017. This meant numerous and cumbersome tax returns for companies having a national presence, resulting in lost revenue. The national Goods and Services Tax (GST) is an online system of tax return filing where the back-end ensures correct tax credits. This system has moved the frequency of tax filings from a quarterly to a monthly basis giving the government a predictable and stable cash flow. A study by the National Council of Applied Economic Research suggested that the implementation of GST has the potential to increase India’s GDP growth rate by 0.9% to 1.7%.
Total GST collected on a monthly basis
The GST has not only helped in easing the tax compliance burden. The interstate movement of goods has improved significantly. The previous system meant traffic jams at state borders on national highways, choking the entire system and delaying the transfer of goods for days. GST, along with a cashless toll payment mechanism called FasTag, has shortened this delay to minutes.
It is now mandatory for every new vehicle in India to have a FasTag sticker which allows direct debit for toll collection from a virtual bank account using a barcode system. The FasTag is a system similar to ones in developed countries where toll collections are automated. This reduces losses emanating from cash collection at toll booths. It also gives a clearer picture of interstate activity and releases more money for road infrastructure maintenance. The Ministry of Road Transport and Highways in India estimates that by implementing FasTag around 350 million litres of fuel were saved in 2021 preventing around 9.8 million tons of carbon dioxide emissions. This saving is primarily due to reduced waiting times at toll booths and higher fleet efficiency. While the reduction in emissions is relatively small compared to the country’s overall emission of more than two billion metric tons in 2020, it is a positive step towards the stated goal of net zero emissions by 2070.
The road and rail infrastructure in India has also been improved significantly in the last few years, highlighting how technology can be used for physical infrastructure. For example, the road network to connect the north-eastern parts of the country is being improved to cut the travel times from a few days to a few hours despite the challenging mountainous terrain. An industrial corridor is being developed between Mumbai and Delhi to cut travel times from 20 hours to 12 hours. Some parts of this road network are being built using recycled waste, thereby creating a positive environmental impact.
How do capital markets benefit from these game-changing technological changes?
Equity markets in India have grown in line with the economy. Market infrastructure is not immune to the use of technology and is changing the way Indians invest. From being a traditional real estate, gold and fixed deposit buying population, Indians are increasingly looking at equities for their savings. Regular monthly contributions called “Systematic Investment Plans” into equity-oriented mutual funds have been showing a steady increase since 2016 and now account for almost US$2 billion every month.
The number of retail investors is steadily increasing due to the availability of information and online platforms which have the option to open a paperless account. The top three stockbrokers based on number of unique active clients are new age fintech players which do not have physical trading locations. They account for more than 40% of the total market share. The incumbents have changed their business models to adopt an online model. Online trades and paperless settlement including cash payments overtook the offline system a few years ago.
With a large and increasing investing population, the counterparty and market risk increases with the time taken to settle the trades. For this reason, regulators are shortening their trade settlement cycles from two days (T+2) to one day (T+1). India is one of the first countries in the world to have introduced this settlement cycle in a phased manner. The US Securities and Exchange Commission is introducing this only in mid-2024.
The vibrant start-up ecosystem in India has attracted strong private equity flows in the last decade. These funds have been able to exit through various modes including IPOs. At the last count, India has produced 108 unicorns (start-up companies with a market capitalisation of more than US$1 billion) with a combined valuation of more than US$354 billion according to Inc42. The listed new age tech-enabled companies are parts of different sectors such as finance, consumer discretionary, retail, communication services, defence and even utilities. Incumbents have also adopted technology to grow and retain market share.
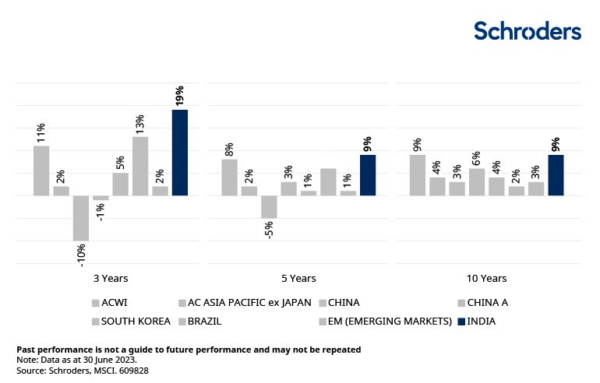
The stock market has benefited from a re-rating of existing businesses and new listings as the breadth of options to invest has increased. Share prices reflect the earnings growth due to the above mentioned structural and macro-economic changes. India has been a strong performer across time periods when compared to other markets, individually or as a basket. India has historically traded at higher valuations compared to other emerging markets most of the time but has different characteristics. For example, countries such as Brazil and China are export oriented whereas India is a net importer. While valuations are important, growth in profits and long-term prospects of the company and its business are also key consideration factors.
Although the Indian equity market can be volatile and may look expensive when compared to other markets, it has delivered superior returns over periods of time. India is a large and deep equity market with a wide range of stock opportunities. We believe that these conditions present a good opportunity for active stock pickers to identify companies with the potential to deliver better than market returns.
Performance of select MSCI indices over periods of time
![]()
Important information
This communication is marketing material. The views and opinions contained herein are those of the named author(s) on this page, and may not necessarily represent views expressed or reflected in other Schroders communications, strategies or funds.
This document is intended to be for information purposes only and it is not intended as promotional material in any respect. The material is not intended as an offer or solicitation for the purchase or sale of any financial instrument. The material is not intended to provide, and should not be relied on for, accounting, legal or tax advice, or investment recommendations. Information herein is believed to be reliable but Schroder Investment Management Ltd (Schroders) does not warrant its completeness or accuracy.
The data has been sourced by Schroders and should be independently verified before further publication or use. No responsibility can be accepted for error of fact or opinion. This does not exclude or restrict any duty or liability that Schroders has to its customers under the Financial Services and Markets Act 2000 (as amended from time to time) or any other regulatory system. Reliance should not be placed on the views and information in the document when taking individual investment and/or strategic decisions.
Past Performance is not a guide to future performance. The value of investments and the income from them may go down as well as up and investors may not get back the amounts originally invested. Exchange rate changes may cause the value of any overseas investments to rise or fall.
Any sectors, securities, regions or countries shown above are for illustrative purposes only and are not to be considered a recommendation to buy or sell.
The forecasts included should not be relied upon, are not guaranteed and are provided only as at the date of issue. Our forecasts are based on our own assumptions which may change. Forecasts and assumptions may be affected by external economic or other factors.
Issued by Schroder Unit Trusts Limited, 1 London Wall Place, London EC2Y 5AU. Registered Number 4191730 England. Authorised and regulated by the Financial Conduct Authority.
Leave a Reply
You must be logged in to post a comment.