Feb
2018
Goldilocks, two bears and a bull
DIY Investor
6 February 2018
![]()
a
Richard Buxton, head of UK equities, tells his version of the classic 19th Century fairy tale.
For much of 2017, the stock market could have been likened to the character of Goldilocks, the little girl who, after some difficulty, eventually found her perfect pot of porridge. One that was neither too hot, nor too cold.
A combination of gently rising economic growth, buoyant labour markets and, to the surprise of many, low inflation has, thus far, translated into a global economy that appears ‘just right’. China’s growth ticks along nicely, Europe is no longer the sick man of the world economy (Brexit induced uncertainties aside) and US data point to gently rising economic growth. But the question for many is this: for how long can the Goldilocks era continue?
As investors, we know that market-moving events can alter the temperature of the porridge at any given moment. How will markets react to a shrinking of the US Federal Reserve’s balance sheet? Is the stimulus instigated by the Chinese authorities finally coming to an end? Is the Phillips curve (the chart that plots the relationship between rates of unemployment and corresponding rates of inflation) dead, or temporarily buried? Inflation, after all, is a key driver of bond markets, which in turn drive equity markets.
While these ‘unknowns’ hang in the balance, for now, let us return to the story line.
Enter bear the first
The pronounced performance of growth stocks at the expense of value stocks has been a recurrent theme ever since value stocks reached their peak in 2007, and a particular hallmark of 2017. In the UK market, it is typically expressed as the gap between consumer staples (the likes of Unilever, Reckitt Benckiser) and growth stocks (Sage, SSP) on the one hand, and value stocks (Barclays, BT and utilities and unloved domestic retailers) on the other.
Those with long memories will know that the last time there was a material unwind of this growth/value skew was the bursting of the tech bubble in 2000-2003, where the rotation from growth to value was particularly vicious in nature and short in duration.
Of course, the conundrum for today’s investors is for how long can the current dispersion continue? And what form will it take? It might be that the dispersion unwinds slowly over time. It might also be that there is no incremental buyer for value stocks. The clue’s in the name. Cheap stocks often remain cheap for a reason.
But that does not mean it won’t happen…
Enter bear the second
So, to the second bear; the keeper of the yield curve. With more US interest rate rises on the horizon, short-dated bond yields, unsurprisingly, continue to rise, (although my second bear, being more of a procrastinator than the first, is unsure if UK interest rates should rise further anytime soon).
Meanwhile, longer dated yields, those with maturities of 10 years or more, refuse to budge. The yield curve looks decidedly flat.
So, what is the presence of this bear telling us? Traditionally, flattish yield curves have, though not always, presaged a slowdown in growth. This time round it could, of course, be different.
We know incremental rises in interest rates are a function of a return to more normal economic conditions, hence short dated yields should be rising. But we also know that once central banks taper their bond purchases, supply will become more readily available and yields should, in theory, start to rise. So why is this not happening?
Timing is everything. Just as it has taken years of central bank largesse to kick start the global economy, similarly it could take years for this stimulus to unwind. Don’t expect bonds to yield nominal GDP (real GDP growth plus inflation) any time soon.
Of course, the counter argument to that is that bond yields could rise more sharply if we get a rogue inflation figure. Europe’s largest trade union, IG Metall, has just asked for a 6% pay rise, in recognition of ‘excellent economic conditions.’ And, referencing growth in technology, not since the 1930s have we had such slack in the economy. But that gap could soon start to narrow and inflationary spirits be rekindled. The Phillips curve could be alive and well, after all.
Enter the bull
As an investor it is all too easy to obsess over short-term problems: Trump, Brexit, monetary tightening, and so on. The longer-term perspective becomes completely obscured. So to end on, here is a chart of why my story contains only two bears and one rather large bull.
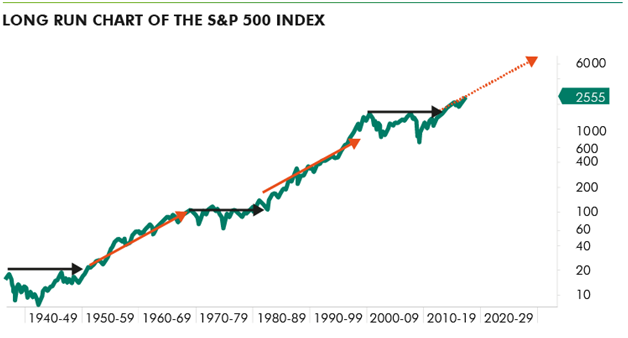
The above is an 80 year logarithmic chart of the S&P 500 index. The years 1936-1950 and 1968-1982, which mark the periods between a bull market peak and the next time the index exceeded that peak, were followed by 18-year bull markets in 1950-1968 and 1982-2000. During those periods the S&P 500 index ratcheted up gains of 400% and 1400% respectively. The last time such an event occurred was in 2013, when the S&P broke through the previous peak of 1550.
The dotted red arrow in the top right corner is a copy of the solid red arrow which marks the 1950-68 bull market. It takes us to 2031 and an index level of 8200.
Of course, there’s no guarantee that this will happen but it could just be that my story has a happy ending after all.
 Richard joined Old Mutual Global investors as head of UK equities in June 2013, and was appointed as chief executive in Auguast 2015. He was previously at Schroders, where he managed the Schroder UK Alpha Plus Fund for over 10 years. Prior to Schroders he spent more than a decade at Baring Asset Management, having commenced his investment career in 1985 at Brown Shipley Asset Management. Richard was awarded the Outstanding Contribution to the Industry honour at the Morningstar OBSR Awards in 2012 and has a degree in English language and literature from the University of Oxford.
Please remember that past performance is not a guide to future performance. The value of investments and the income from them can go down as well as up and investors may not get back any of the amount originally invested. Exchange rate changes may cause the value of overseas investments to rise or fall.
Issued by Old Mutual Global Investors (UK) Limited (trading name, Old Mutual Global Investors), a member of the Old Mutual Group. Old Mutual Global Investors is registered in England and Wales under number 02949554 and its registered office is 2 Lambeth Hill London EC4P 4WR. Old Mutual Global Investors is authorised and regulated by the UK Financial Conduct Authority (“FCA”) with FCA register number 171847 and is owned by Old Mutual Plc, a public limited company limited by shares, incorporated in England and Wales under registered number 3591559.
This communication is for information purposes only and does not constitute a financial promotion (as defined in the Financial Services and Markets Act 2000) or other financial, professional or investment advice in any way. Nothing in this document constitutes a recommendation suitable or appropriate to a recipient’s individual circumstances or otherwise constitutes a personal recommendation. It is distributed solely for information purposes, it does not constitute an advertisement and is not to be construed as a solicitation or an offer to buy or sell any securities or related financial instruments in any jurisdiction. No representation or warranty, either expressed or implied, is provided in relation to the accuracy, completeness or reliability of the information contained herein, nor is it intended to be a complete statement or summary of the securities, markets or developments referred to in the document. Any opinions expressed in this document are subject to change without notice and may differ or be contrary to opinions expressed by other business areas or groups of Old Mutual Global Investors as a result of using different assumptions and criteria. This communication is for retail investors. A member of the IA. OMGI 01_18_0098.
Commentary » Latest » Mutual funds Commentary » Mutual funds Latest » Take control of your finances commentary
Leave a Reply
You must be logged in to post a comment.