Oct
2022
Gimmie shelter
DIY Investor
20 October 2022
Our analysts examine safe havensand defensive strategies as we endure the markets’ 19th nervous breakdown…by Nicholas Todd
The testing times many markets have faced this year have led to dramatic sell-offs across a wide range of strategies, and particularly of those with an equity focus. Investment trusts have also been affected, as uncertainty remains elevated, interest rates continue to rise and the outlook for growth remains subdued while discounts have widened across the board.
At least one traditional safe haven asset has proven valuable during these turbulent times. As we touched on in a recent article, the dollar has again proven to be a safe haven over the first nine months of this year. Yet we think it unlikely that many readers hold dollar cash, so this is not likely to have been helpful to most portfolios. Here we therefore review how defensive assets and strategies have performed in the investment trust space this year, where some asset classes have been more successful than others.
Protective diversifiers
We have previously identified an interesting potential subsector of the flexible investment trust sector: ‘protective diversifiers’. These trusts place a greater emphasis on capital preservation and have a steadier long-term compounding approach to return generation. This is often perceived as a strategy that will lag the equity market in times of high growth, although year to date we have seen that downside protection can offer solace in an uncertain equity market.
The latest CPI figures coming out of the US and the UK suggest inflation rates are likely to remain at elevated levels for longer than expected, despite the sharp pace of interest rate hikes from monetary authorities. Ruffer Investment Company (RICA) is one trust that has performed strongly so far this year. We think this is a reflection of manager Duncan MacInnes’s ability to successfully navigate the volatility in the markets and maintain a stability of returns through his flexible investment approach and tactical use of more unconventional derivative strategies.
Furthermore, RICA’s portfolio has long been positioned to benefit from structurally higher inflation – a view shared with the likes of Capital Gearing Trust (CGT) and Personal Assets (PNL). Over 25% of RICA’s portfolio is currently invested in international and UK index-linked bonds, in addition to the high-conviction equity positions which have been built up for such an environment.
The portfolio also benefits from a relatively short total duration of just under three years, which to some extent offsets the pressures from rising interest rates seen elsewhere in growthier portfolios holding long-duration assets.
RIT Capital Partners (RCP) is another trust that aims to provide long-term growth whilst protecting shareholders’ capital. The managers do this by investing in a broad range of asset classes – both directly and through third-party managers – which are expected to deliver returns in a range of different market conditions.
Although these haven’t provided the best performance year to date, the managers’ approach has had a positive impact on the overall risk of the portfolio, which is also bolstered by the use of various hedging strategies, differentiating it from many other multi-asset funds. RCP has been held back this year by venture funds and private assets that have often had exposure to technology or China, two themes which have been under pressure.
In addition, and similarly to Aberdeen Diversified Income & Growth (ADIG), RCP has a significant allocation to private investments which has positively contributed to performance over the course of the year.
Both these trusts provide access to opportunities that are often outside the grasp of individual investors and indeed other professional investment vehicles, which is a testament to the managers’ private market networks and experience. ADIG’s recent mandate shift to increase its private market allocation up to 45% has been particularly successful over the last 12-month period, with the trust one of a handful in the sector to maintain positive NAV performance.
As the table below highlights, the trusts in this subsector have exhibited particularly defensive characteristics, as shown by their relatively low volatility, low maximum drawdowns and less correlated returns to the market (as demonstrated by their equity market beta).
FLEXIBLE INVESTMENT SECTOR PERFORMANCE STATISTICS (YEAR TO DATE)
| CUMULATIVE RETURN (%) | ANNUALISED STANDARD DEVIATION (VOLATILITY) (%) | MAXIMUM DRAWDOWN (%) | DOWNSIDE CAPTURE | UPSIDE CAPTURE | BETA (TO ACWI) | |
| Ruffer Investment Company | 6.1 | 5.5 | -2.9 | -13.6 | 26.3 | 0.34 |
| Aberdeen Diversified Income & Growth | -2.3 | 3.5 | -2.3 | 19.6 | 15.9 | 0.43 |
| RIT Capital Partners | -9.1 | 5.3 | -9.1 | 41.7 | -5.4 | 0.43 |
| Personal Assets | -4.2 | 7.2 | -4.7 | 41.9 | 40.5 | 0.43 |
| Capital Gearing Trust | -3.9 | 7.6 | -4.9 | 40.8 | 40.7 | 0.61 |
| Morningstar Flexible Investment sector average | -5.0 | 5.0 | 5.0 | 40.9 | 30.8 | 0.55 |
| iShares MSCI ACWI ETF | -9.8 | 14.6 | -10.7 | – | – | – |
Source: Morningstar, as at 30/09/2022
Past performance is not a reliable indicator of future results
Gold
Over the past couple of years there has been much attention given to gold in relation to its defensive characteristics. Historically, the precious metal has been considered a safe haven providing a store of value during volatile market conditions. These characteristics have resulted in significant gold allocations within more defensive capital-preservation strategies such as PNL, which currently has an allocation of 12% to gold-related investments, of which 8% is to gold bullion.
We saw the positive impact that this allocation had on performance during the height of the coronavirus pandemic in 2020, as investors flocked to such assets for fear of the unknown. This was combined with stimulus programmes coming from policymakers to support economies, which made gold’s zero yield relatively more attractive as interest rates were slashed to historical lows. Both these factors contributed to gold breaching $2,000/oz in August 2020.
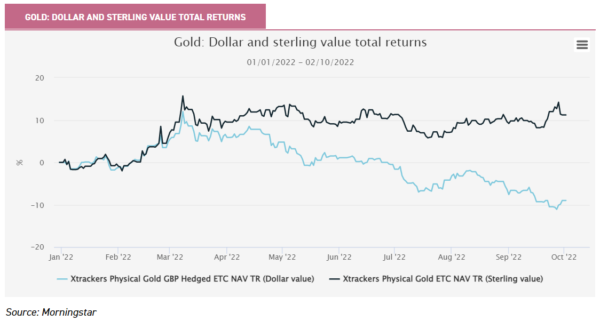
Since then, the asset has been volatile: in dollar terms the price reverted to $1,683/oz before momentarily bounding through the $2,000/oz level in March 2022 following the outbreak of the Russia–Ukraine war. Then it followed a downward trend to its current value of $1,648/oz. Gold is now down 9.8% year to date in USD terms. This suggests it offers little in the form of protection against rampant inflation or against equity market drawdowns, making it seemingly unsuitable for the more risk-averse investor.
However, if we look at gold’s performance in sterling terms, which is probably more relevant to the average KTI reader, we find a slightly different picture. As shown in the graph below, year to date gold’s value has increased by c. 11.2%. GBP, like just about every currency, has sold off against the dollar, but an investment in gold would certainly have helped protect a sterling portfolio against this trend.
It is also interesting to consider the performance of the gold mining equities, which are often used in portfolios because correlations to the underlying physical gold are thought to be closely related, thus potentially offering geared exposure.
Following a strong start to the year, the gold miners have sold off by -29.9% (as per the open-ended iShares MSCI Global Gold Miners ETF). This can be attributed to the falling dollar value of the commodity and the heavy capital expenditure cost associated with the industry, as well as to rising fuel costs and exposure to an increased cost of financing from rapidly rising interest rates over the course of this year.
Trusts such as BlackRock World Mining (BRWM) could offer some exposure to any recovery in gold miners, which are a historically unloved sector. The trust’s current allocation of c. 16% is balanced by an allocation to industrial metals with a very different return profile, thus offering diversification.
Bonds
Government bonds are typically classed as defensive assets in an investor’s portfolio. Ideally, they should provide gains when equity markets fall, as investors rush to safety and interest rates are lowered. However, this year duration has seen a huge sell-off – most recently felt in long-dated UK linkers with structurally high duration. Corporate bonds and other riskier fixed income also bring credit exposure, which tends to be correlated to equity markets and has sold off in 2022.
While traditional fixed income investments have been pretty poor this year, the investment trust space is home to a number of more innovative portfolios which have offered better protection, such as M&G Credit Income (MGCI). MGCI generates income that is linked to fluctuations in interest rates, with 85% of the portfolio’s income coming from floating rate assets. Therefore, as central banks raise rates, the income rises and the cash available for distribution also rises.
Furthermore, MGCI’s lead manager Adam English has the flexibility to invest across both the public markets and private markets. Taking such an approach therefore provides shareholders with access to areas of the market which may ordinarily be harder to reach, with the investment trust structure providing liquidity to shareholders through tradeable shares to a predominantly illiquid underlying portfolio.
Moreover, private market assets typically offer higher yields than those available in the public investment-grade market, even though credit risks may be similar. The floating rate nature of the investments in the portfolio also contributes to the portfolio’s very low duration, which – although higher than at the start of 2022 – is currently one and a half years, meaning the trust maintains minimal price exposure to rising rates compared to conventional bond funds.
MGCI has sold off in the most recent market events, which we see as providing an opportunity, given the relatively stable NAV and income exposed to rising rates. At the time of writing the trust’s discount is 10%.
Also offering a high exposure to low-duration floating rate instruments is NB Global Monthly Income Fund (NBMI). NBMI’s managers utilise the full breadth of a 50-person non-investment-grade team, providing further diversification through a significant exposure to alternative credit, including private markets, alongside traditional credit. This includes allocations to the CLO, distressed debt and special situations markets, allowing the managers to find stock-specific opportunities offering investors access to even greater yields that are usually restricted to institutions – NBMI currently generates an ungeared yield of 6%.
LOANS & BONDS SECTOR PERFORMANCE STATISTICS (YEAR TO DATE)
| CUMULATIVE RETURN (%) | ANNUALISED STANDARD DEVIATION (VOLATILITY) (%) | MAXIMUM DRAWDOWN (%) | DOWNSIDE CAPTURE | UPSIDE CAPTURE | BETA (TO ACWI) | |
| M&G Credit Income | -2.2 | 3.7 | -4.2 | 11.2 | 1.2 | 0.37 |
| NB Global Monthly Income Fund | -11.9 | 9.0 | -11.9 | 74.3 | 27.8 | 0.62 |
| iShares MSCI ACWI ETF | -9.8 | 14.6 | -10.7 | – | – | – |
Source: Morningstar, JPMorgan Cazenove, as at 30/09/2022
Past performance is not a reliable indicator of future results
Hedge funds
The standout hedge fund performer this year has been BH Macro (BHMG), the GBP share class of which has generated an NAV total return of 20.7% over 2022. Unlike many investment strategies, Breven Howard’s (the manager) house view is not enforced on BHMG’s traders. Instead, it is the capital allocations to traders and strategies that are set by Brevan Howard’s investment committee, with the traders granted full discretion with respect to their strategies.
A significant portion of them have exposure to developed bond and currency markets through the construction of trades designed to have option-like payoffs. Historically, the strongest performance has come at times of stress for equity and bond markets, so the economic environment this year is tailor-made for such a strategy.
The ability of the managers to control downside risk is also an attractive quality of the fund, and risk management is a key part of the investment process, as demonstrated by the trust’s low standard deviation of 5.6%. Yet we caution that such standout performance is reflected in the trust’s significant premium of 12.3%, which may present a challenge for new investors to enter if NAV returns are under expectations and the shares de-rate.
HEDGE FUND SECTOR PERFORMANCE STATISTICS (YEAR TO DATE)
| CUMULATIVE RETURN (%) | ANNUALISED STANDARD DEVIATION (VOLATILITY) (%) | MAXIMUM DRAWDOWN (%) | DOWNSIDE CAPTURE | UPSIDE CAPTURE | BETA (TO ACWI) | |
| BH Macro | 21.5 | 5.6 | – | -52.9 | 72.9 | 0.28 |
| Morningstar Hedge Funds sector average | 9.9 | 7.6 | -2.1 | -7.5 | 68.5 | 0.24 |
| iShares MSCI ACWI ETF | -9.8 | 14.6 | -10.7 | – | – | – |
Source: Morningstar, as at 30/09/2022
Past performance is not a reliable indicator of future results
Conclusion
As we have shown, year to date some trusts have been successful amongst the wreckage of the market, either by generating returns or by at least limiting their losses. We haven’t considered the broad number of alternative assets and real assets yet, many of which are designed to be defensive in nature, and which we will examine in more detail in the coming weeks. Yet we end by being the bearers of bad news. According to data compiled by Goldman Sachs and Ruffer, the unfortunate truth is that bear markets tend to last much longer and experience much harsher declines than we have experienced thus far, as demonstrated in the charts below. We therefore believe that protective and diversified assets are likely to remain an important allocation for most investors in the coming months and years.


Disclaimer
This is not substantive investment research or a research recommendation, as it does not constitute substantive research or analysis. This material should be considered as general market commentary.
Brokers Commentary » Commentary » Investment trusts Commentary » Investment trusts Latest » Latest » Mutual funds Commentary
Leave a Reply
You must be logged in to post a comment.