Jan
2023
Fortune favours the brave
DIY Investor
21 January 2023
Our research suggests a recession has already been priced into small cap trusts, but risks abound…by Nicholas Todd
At the time of writing, the average discount for the UK Smaller Companies sector is 11.4%, after a year in which risk aversion ruled and investors prepared for a recession. While there is still plenty of uncertainty around the immediate future, a peak in inflation may be in the rear-view mirror and a peak in interest rates may be on the horizon. Additionally, UK small caps have been a great place to invest over the long term. In our view, this is an interesting time to be looking at the sector and, below, we outline the variety of strategies available in the sector which offer different options for investors with different objectives and outlooks.
The opportunity
UK small caps have consistently generated excess returns over UK large caps. The chart below illustrates this over ten-year rolling periods from 1996 to the end of the last month. We calculate that the Numis Smaller Companies Index has outperformed the FTSE 100 Index 77.8% of the time, with an average outperformance of 4.1% in the periods small caps have outperformed. Over five and one-year rolling periods, small caps have also outperformed, 61.9% and 57.2% of the time, respectively, or a rolling average outperformance of 1.3% and 1.7% per annum, respectively. The message seems to be that holding small caps for the longer term increases the chance of outperformance, at least based on past patterns of behaviour.
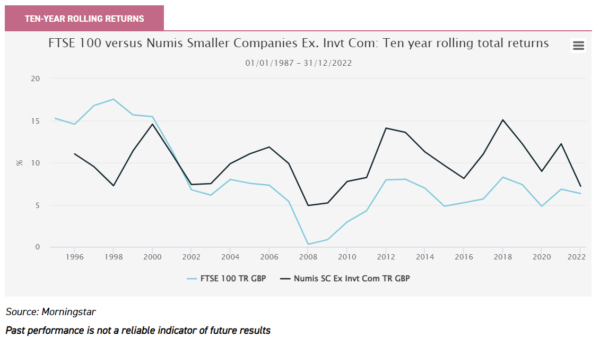
In addition, we note that a large portion of this outperformance has come from the sharp bounce back in performance following periods of significant drawdowns. For example, in the year immediately following the double-dip recession of the early 1990s, the Russian financial crisis in 1998 and the Great Financial Crisis in 2008, small caps generated an average outperformance of 28.4%. This is interesting, given the sell-off we have seen over 2022 – could it be that the bottom is in? In a recent strategy article, we discussed the sort of signs investors might be looking for and we think this is a good time to be considering raising exposure.
High-risk, high-growth strategies
By its very nature, the UK Smaller Companies sector displays higher-risk characteristics when compared to large cap-focussed strategies, as demonstrated by the Numis Smaller Companies Index’s five-year annualised standard deviation of 20%, compared to the FTSE 100 Index’s 13.9%. Within this cohort of trusts, we have identified some strategies which embrace the extra risk involved in small-cap investing and look to maximise the potential return available from the extra growth potential in the businesses. As shown in the table below, these tend to have higher than average P/E ratios as investors price in companies’ future earnings potential in the share prices. However, this more forward-looking approach is often reflected in higher levels of volatility.
Five-year characteristics
| INVESTMENT TRUST | CUMULATIVE RETURNS (%) | ROLLING UPSIDE CAPTURE RATIO* | ROLLING DOWNSIDE CAPTURE RATIO* | LATEST P/E RATIO (NOV 22.X) | VOLATILITY (%) |
| BlackRock Throgmorton | 91.3 | 114.8 | 103.2 | 18.3 | 23.3 |
| BlackRock Smaller Companies | 102.1 | 117.0 | 99.4 | 14.7 | 23.1 |
| JPMorgan UK Smaller Companies | 79.4 | 112.7 | 105.9 | 11.4 | 25.2 |
| Aberdeen Smaller Companies Growth | 102.6 | 107.4 | 81.1 | 19.2 | 22.8 |
| Henderson Smaller Companies | 91.3 | 123.9 | 116.3 | n/a | 24.3 |
| Numis Smaller Companies Ex. Invt Comp Index | 63.6 | n/a | n/a | 9.7 | 20.0 |
Source: Morningstar as at 31/12/2022, *Up and down capture ratios calculated using Numis Smaller Companies ex. Int comps Index as benchmark.
Past performance is not a reliable indicator of future results
Two trusts from BlackRock fall into this category. BlackRock Throgmorton Trust (THRG) is managed by Dan Whitestone, who aims to identify companies that have a long runway of fundamental growth ahead of them. The focus is on sector leaders seeking the most innovative solutions to benefit from secular growth opportunities. Volatility has been high and reflects Dan’s ability to take long/short positions when he believes a company is likely to over/underperform, using options such as contracts for difference (CFDs). This effectively allows the trust to ‘gear up’, supplementing not just the shares’ upside but also downside performance. Despite THRG’s short-term NAV underperformance, Dan remains confident in the strong fundamentals of the portfolio holdings and over five years THRG has generated one of the highest NAV total returns in the sector, at 17.5%. THRG is currently trading at a discount of 3.1%, broadly in line with its five-year average of 3.7%.
BlackRock Smaller Companies (BRSC), which is managed by Roland Arnold, follows a similar high-quality, growth-focussed approach. Roland has the freedom to invest in anything from AIM-listed stocks with market caps below £150m, up to small/mid-cap stocks with a £2bn market cap. Roland also takes a stylistically-diverse approach which has translated into an arguably more consistent returns’ profile, with the bonus of a small but consistent dividend. The use of structural gearing can also enhance returns but its longer-term and fixed nature means that the negative impact from interest rate rises will be less significant. The underlying strength of the portfolio companies competitive advantages and balance sheets could mean they are likely to fare well in a persistent inflationary and higher interest rate environment. Roland’s ability to diversify holdings into more cyclical stocks across a broad spread of holdings could help to reduce stock-specific risk often associated with smaller companies’ investing. We believe the current discount of 13.4% could prove to be an attractive entry point, especially once fundamentals resume being the dominant driver of equity returns.
JPMorgan UK Smaller Companies (JMI) is another trust with a strong long-term track record. The trust sits within the ‘high risk’ category because its five-year volatility is the highest within the sector, at 25.2%. However, the managers, Georgina Brittain and Katen Patel, have a long-term focus on growth and this has resulted in, at times, sector-leading returns. A five-year NAV total return of 31.7% was generated with an alpha of 6.6% – the highest in the sector. This is, perhaps, aided by the resources available at JPMorgan which are arguably particularly important considering the idiosyncratic nature of the sector.
Middle of the road
The second category we identify provides an option for investors seeking a more balanced investment approach, less focussed on high octane capital growth. The table below shows some trusts we think fit into this category. Aberforth Smaller Companies (ASL) has a clear value-tilt and has the highest allocation to value of any trust in the sector, excepting its sister trust, Aberforth Split Level Income (ASIT). IPU and ASCI, on the other hand, have strong core allocations with more modest allocations to growth.
Current styleallocations
| INVESTMENT | % VALUE EQUITY ALLOCATION | % GROWTH EQUITY ALLOCATION | % CORE EQUITY ALLOCATION |
| Aberforth Smaller Companies | 54.7 | 6.9 | 42.3 |
| Invesco Perpetual UK Smaller Companies | 16.9 | 41.5 | 40.5 |
| Aberdeen Smaller Companies Income | 7.7 | 64.3 | 52.5 |
| UK Smaller Companies sector average | 25.2 | 29.0 | 36.3 |
Source: Morningstar, as at 31/12/2022
Invesco Perpetual UK Smaller Companies (IPU) offers investors the quintessential barbell investment approach which the managers, Jonathan Brown and Robin West, believe will benefit in this persistently uncertain macroeconomic environment, through a combination of growth-orientated companies and undervalued opportunities. Along with a conservative approach to gearing, this flexible yet balanced approach helps reduce the overall levels of volatility. In our view the focus on the strength of their underlying companies means they may be able to capture market share and benefit from a recovery. The added ‘sweetener’ of a 5.3% dividend yield, as at 11/01/23, combined with the absolute and relatively wide discount of 15.4%, could also offer good value for a more income-conscious investor as well as those looking to exploit the discount.
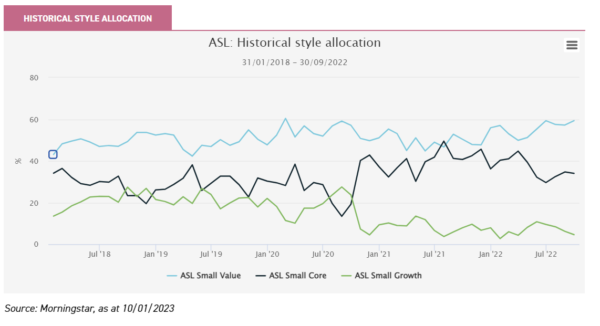
Alternatively, Aberforth Smaller Companies (ASL) offers investors a clearly differentiated value-style approach which stands out amongst a growth-dominated UK small-cap space. As shown in the chart below, the managers have consistently adhered to this investment approach and the strategy has a strong track record of delivering good long-term returns. Although ASL’s performance has struggled in the short term on an absolute basis, it has generated the strongest return in the sector of -7.8% over the past 12 months versus the sector’s simple average of -20.5%. The focus on valuations has resulted in a portfolio better-positioned to benefit from a higher inflation and interest rate environment. ASL trades at a discount of 12.4%.
We believe that it is further down the market cap spectrum where the highest diversification benefits can be found, and where company returns are likely to be the least dependent on general market returns. Miton UK MicroCap (MINI), focusses on companies that have market capitalisations of less than £150m. The managers, Gervais Williams and Martin Turner, believe that these are the stocks that have the potential to offer investors exponential returns. In addition, they believe the universe presents unique opportunities to identify fundamentally strong, cash surplus-generating businesses that often operate under the radar of investors due to their lack of analyst coverage. Furthermore, Gervais and Martin’s long-term contrarian views are founded on the reversal of multi-decade long trends, including low interest rates and the expansion of cheap credit. This has, inevitably, reduced the historical correlation with growth strategies that have performed in recent years. Together with their unique focus on company management and the reintroduction of the FTSE 100 Index Put option, MINI offers a unique proposition.
Downing Strategic Micro-Cap (DSM) offers a similar exposure and looks to exploit the inefficiencies of the micro-cap market through undervalued opportunities. However, the managers take a much more concentrated approach, with total holdings ranging from ten to 25, with nine holdings representing over 5% of NAV, as at 01/09/2022. However, although DSM has been the third-best performer on a NAV total return-basis over the past 12 months amongst the trusts analysed here, the shares trade at a wide discount of 16.2%. Historically, the board has been reluctant to buy back shares in extreme selling periods. However, over the course of the year, they have had to do so to ensure liquidity for shareholders. Furthermore, the board recently reiterated its plans for an investor redemption opportunity in May 2024, enabling shareholders to redeem 50% of their holding at NAV. Given that the cash allocation is currently c. 16%, the board believes this presents a double-discount opportunity. If the redemption facility is fully subscribed, the board intends to conduct a strategic review which may lead to a winding up of the trust.
The manager of River and Mercantile UK Micro Cap (RMMC), George Ensor, also takes a high-conviction approach, exploiting the long-term benefits associated with using a closed-ended investment trust structure. However, the strategy only permits George to invest in companies with market capitalisations below £100m at the time of purchase. The strategy is centred around exploiting the systematic bases and mistakes of the market, using fundamental analysis and the longstanding quantitative screening approach used across all the investment strategies of River and Mercantile, the investment manager. This is centred around their PVT (Potential, Valuation, Timing) criteria. It is worth noting that all three strategies mentioned in this category have a value-tilt in their investment approach.
Five-year diversification statistics
| INVESTMENT | % MICRO-CAP HOLDINGS (LONG ONLY) | % SMALL CAP HOLDINGS (LONG ONLY) | CORRELATION TO NUMIS SC EX. INVT COMPS | BETA TO NUMIS SC EX. INVT COMPS | VOLATILITY (%) |
| Miton UK MicroCap | 87.1 | 3.0 | 0.82 | 0.88 | 22.5 |
| Downing Strategic Micro-Cap | 43.1 | 6.3 | 0.89 | 0.75 | 16.9 |
| River and Mercantile UK MicroCap | 93.3 | 3.5 | 0.88 | 0.90 | 20.8 |
Source: Morningstar, as at 31/12/2023
High current income and dividend resilience
Smaller companies-investing is typically associated with identifying companies that are at the start of their growth trajectory, which typically leaves little opportunity for any significant dividend as the focus tends to be on reinvesting profits to fuel future growth. However, we’ve identified several strategies that do provide investors with a decent level of income with respect to the UK Smaller Companies sector, but which are also comparable to the 4.5% average dividend yield of the UK Equity Income sector. As shown in the table below, Aberforth Split Level Income (ASIT) offers the highest yield at 5.9%, thanks to a highly-geared structure which we discussed in our recent note. With the current discount at 10%, this may present an attractive opportunity for income-seeking investors, particularly given the short remaining life.
Current 12-month yield
| INVESTMENT TRUST | 12-MONTH YIELD (%) |
| Aberforth Split Level Income | 5.9 |
| Aberdeen Smaller Companies Income | 4.0 |
| Montanaro UK Smaller Companies | 4.1 |
| Invesco Perpetual UK Smaller | 5.3 |
Source: Morningstar, JPMorgan Cazenove as at 11/01/2023
Another option is Montanaro UK Smaller Companies (MTU). The investment team at Montanaro is dedicated exclusively to researching and investing in quoted smaller companies. MTU’s manager, Charles Montanaro, takes a truly active investment approach, targetting high-quality companies that are focussed on self-funded organic growth and their core area of expertise. It may also present an option for ESG-conscious investors, as such considerations have been fully-integrated into the investment process for over two decades. MTU also offers shareholders a regular income, with the board distributing the equivalent of 1% of its NAV each quarter resulting in a dividend yield of c. 4% per annum.
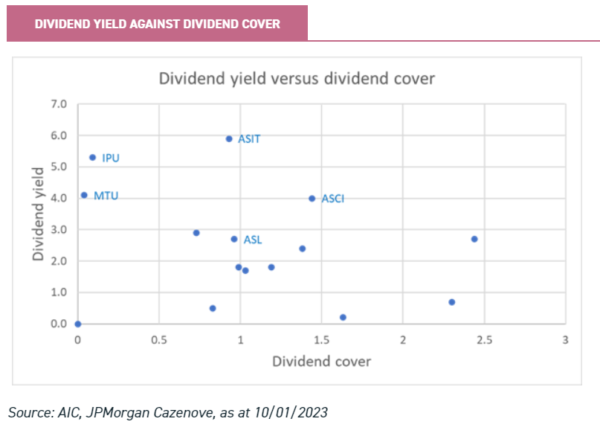
abrdn Smaller Companies Income (ASCI) balances the objectives of long-term capital growth alongside an attractive yield. The current discount is 16.3%, which is the second-widest in the sector. We believe this may be a reflection not only of ASCI’s stylistic growth-tilt, but also of the management change which has seen the retirement of veteran smaller companies’ manager, Harry Nimmo, at the end of last year. Given the extended period that the new managers, Amanda Yeaman and Abbie Glennie, have worked alongside Harry, we see this having little impact on the longstanding investment strategy. Furthermore, following the recovery of the income received from the portfolio’s holdings alongside the trust’s significant revenue reserves, which is reflected in the trust’s relatively high dividend cover, as shown in the chart below, we believe that this should enhance the sustainability of the dividend.
Conclusion
We believe that there is a fair argument to suggest that a recession has already been priced into the UK small cap trusts. We have shown above what we believe to be a variety of strategies on offer in the sector. We should note that we have omitted from our analysis a few unusual trusts which we don’t think fit the bill for the average investor looking for small-cap exposure. We stress that trusts in all the categories are trading at discounts at the current time and, whatever their specific approach, all will have sensitivity to any UK recovery by virtue of being invested in the UK small-cap market.
12-month NAV performance and current discounts
| 5 YR. NAV TOTAL RETURN (%) | DISCOUNT (%) | EQUITY STYLE – VALUE (%) | EQUITY STYLE – GROWTH (%) | EQUITY STYLE – CORE (%) | YIELD (%) | |
| Aberforth Smaller Companies | 10.0 | -12.4 | 54.7 | 6.9 | 42.3 | 2.7 |
| Aberforth Split Level Income | -3.8 | -13.4 | 63.7 | 7.8 | 62.6 | 5.9 |
| abrdn Smaller Companies Income | -2.6 | -16.3 | 16.2 | 36.2 | 52.5 | 4.0 |
| abrdn UK Smaller Companies Growth | 8.0 | -12.0 | 7.7 | 64.3 | 29.4 | 1.8 |
| BlackRock Smaller Companies | 14.3 | -13.4 | 14.4 | 48.1 | 33.0 | 2.7 |
| BlackRock Throgmorton | 19.0 | -3.1 | 7.6 | 52.2 | 42.5 | 1.7 |
| Downing Strategic Micro-Cap | -17.8 | -16.2 | 5.2 | 3.8 | 40.4 | 0.5 |
| Henderson Smaller Companies | 5.1 | -11.7 | 20.6 | 40.9 | 47.9 | 2.9 |
| Invesco Perpetual UK Smaller | 10.2 | -15.4 | 16.9 | 41.5 | 40.5 | 5.3 |
| JPMorgan UK Smaller Companies | 30.7 | -8.9 | 25.6 | 56.9 | 23.2 | 2.4 |
| Miton UK MicroCap | 2.8 | -6.9 | 26.3 | 24.4 | 31.8 | 0.2 |
| Montanaro UK Smaller Companies | -1.5 | -2.8 | 3.7 | 57.0 | 34.6 | 4.1 |
| Rights & Issues Investment Trust | 5.3 | -16.9 | n/a | n/a | n/a | 1.8 |
| River and Mercantile UK Micro Cap | -9.2 | -10.2 | 27.1 | 39.2 | 30.4 | 0.0 |
| Strategic Equity Capital | 14.4 | -6.2 | 10.6 | 12.9 | 32.6 | 0.8 |
| Average | 5.7 | -11.1 | 21.5 | 35.1 | 38.8 | 2.4 |
Source: Morningstar and JPMorgan Cazenove, as at 10/01/2022
Past performance is not a reliable indicator of future results

Disclaimer
This is not substantive investment research or a research recommendation, as it does not constitute substantive research or analysis. This material should be considered as general market commentary.
Brokers Commentary » Brokers Latest » Investment trusts Commentary » Investment trusts Latest » Latest » Mutual funds Commentary » Uncategorized
Leave a Reply
You must be logged in to post a comment.