Dec
2023
Fool’s gold
DIY Investor
9 December 2023
Cash would have been a poor investment during this period of high inflation…by Thomas McMahon
One of the most memorable Derren Brown specials had a victim hypnotised in a bar, only to wake up in what appeared to be a post-apocalyptic wasteland. It was an amazing illustration of the power of suggestion. The subject eventually even accepted the existence of zombies, which we can only assume he was previously aware are fictional… How could he be led to this point? It seemed to be the total consistency of the environment, the actors and all the information he had around him pointing to this delusion that allowed him to entertain the bizarre thought. Maybe a similar mechanism is at work when it comes to inflation. As long as numbers are presented in nominal terms, time after time, we are prone to overlook, forget, or ignore that we are actually getting poorer so long as our nominal return is behind inflation. In this note, we look at what investors would actually have received in real terms if they had invested in cash through this period of high inflation, and how that compares to real returns from equities. It isn’t a great record, to be honest. And while investors continue to allocate even more to cash and short-dated bonds, we argue that this is the wrong time to be doing so.
The greatest trick the devil pulled
When deciding whether or not to invest in cash, we are not helped by the fact that we typically have a forward-looking rate and a backward-looking inflation number. There are plenty of charts currently flying around showing interest rates on deposits finally above inflation, but what they show is the rate you will get over the inflation you did experience. To know whether the rate on offer is above inflation, you need to know what inflation will be in the future, which is sadly impossible without divine intervention. What we can examine though, is what you would have received by investing in cash one year ago, as we know what inflation has been since then.
The chart below shows the average one-year ISA rate on offer (according to the Bank of England (BoE)) and the CPI rate that was calculated over the next 12 months. In green, we have plotted the real rate achieved. It shows that an investment in cash in late 2021, when the scale of the inflation crisis began to be recognised, would have led to a real loss of around 10% over 12 months. It also shows that even investing when savings rates were around 4%, approximately one year ago, the real return achieved would have been negative over the next 12 months.

It is called the money illusion because like a magic trick, each time you look at it you have to remind yourself it is a trick. Just to underline the point and make it more vivid, the chart below shows the real value of an investment of £10,000 in the average ISA in October 2021. We have taken the average ISA rate on offer in any month and adjusted it for the month-on-month inflation experienced in that month. This shows that whatever your bank balance said, you would have actually lost around 20% of your original investment by mid-2023, and now you would actually have just c. £9,000 left in 2021 money.

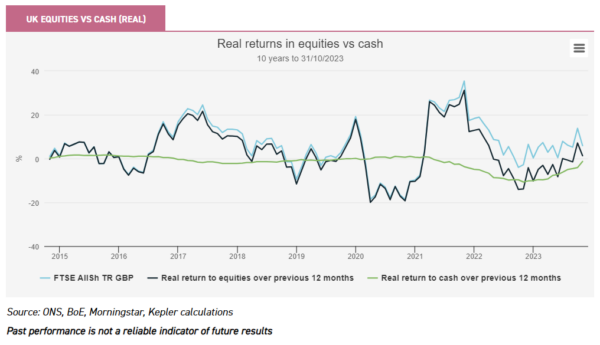
So, an investment in cash would have been a loser on a 12-month period throughout this inflation shock for as long as we can calculate it, and if you had moved into cash in late 2021 as the storm clouds gathered you would have lost around 10% in real terms. But one of the reasons you would have moved into cash is out of fear of a worse result in equities. Would you have done better in cash than equities, at least? Well, not really. The below chart shows inflation-adjusted returns to UK equities and to cash on a rolling 12-month basis. Since inflation began to pick up in late 2021, there have only been three months in which you would have done better in cash than equities over the past year, having lost just a bit less. Interestingly, you would have done much better in cash than UK equities during 2020, due to low inflation coupled with a major sell-off in the FTSE 100. This reflects the results of going to cash in early 2019 though, and if you had gone to cash in February 2020, when the pandemic hit, and stayed there for a year, you would have been worse off than if you had bought equities.
If you are suspicious by nature, you may be complaining that the FTSE 100 has had a relatively good period of performance over the past two years, since higher interest rates have brought to an end the period of growth outperforming value, and so this isn’t a fair test. Additionally, people invest globally now, you could argue, rather than in their home market, so we should really look at what cash has done against global markets. The picture is indeed slightly better on this basis, with about 12 months of real returns in cash being less negative than those in equities, and the difference in returns being higher. Crucially, however, real returns to equities have been better since April. To be clear what this means: if you had invested in equities rather than cash at any month-end from April through to October 2022, when the inflation crisis was most acute and cash rates were accelerating upwards, you would have done better over the next 12 months than if you had invested in cash.

As these are one-year rolling periods, they don’t capture the cumulative effects of declines and inclines. So, to wrap up this analysis, below we show how an investment of £10,000 in cash would have done in real terms versus an investment in UK equities and one in global equities, both also in real terms. This time we have looked over a two-year period, capturing the sell-off in equities as well as the acceleration in inflation expectations. If you had just left your money in the UK market rather than sell and go to cash, you would have basically ended up in the same place in real terms. You have indeed done better in cash than in global equities though, thanks to the greater impact of the initial market declines on global indices which are driven by large-cap tech stocks which proved to be very sensitive to interest rates.

Our conclusion would be that the outperformance of cash has generally been fleeting and has generally been due to exceptionally strong sell-offs in global equities rather than inflation. Another important point is that cash rates have been at their worst just when equity rates are. There are a few occasions in which investing in cash rather than stocks has done better over a 12-month period, but these have been when disappointing returns in cash have been slightly less disappointing than returns in equities.
Think of a number, any number
So, what about the future? Should we expect better real returns in cash than equities? Our first chart above uses annual data, and so the line for the real rate achieved in cash ends with an investment one year ago. But ISA rates have continued to rise since then. Our second chart uses month-on-month data, and from that can be deduced that there have been some months in which savings returns have exceeded monthly CPI. These were only January, July, and October, with the intervening months being negative. Nonetheless, the picture is better for cash than it has been. So, are there realistic prospects for cash to outperform in real terms over the next year or so?
For cash, positive returns would come if the ISA rate (read: Bank rate) stayed above inflation. It certainly seems unlikely to us that we will see rate cuts in the first half of the year. Andrew Bailey’s comments have to be taken with a pinch of salt as his words are his weapons, but his recent warning that rates would have to stay higher than many expect is more than simply a plea for people to restrain spending, in our view. He also commented that getting inflation down from 4% to 2% would be much harder than getting it down from 12% to 4%.
The chart below shows market expectations of UK rates, from Bloomberg, against the Bank of England’s central forecast for annualised CPI. It implies a real return of c. 1% to cash through next year. If we assume you lock in the one-year rate now, then the implied real return over the next year is as high as 1.8%. The upshot is that the outlook for a cash investment is better than it has been during this period of high inflation.

s this a better option than investing in equities? Well, the historic dividend yield of the FTSE is 3.95% at the time of writing. Assuming a similar yield is achieved over the next 12 months, that would give a real return of 0.55% from income alone. It would only take a price increase of 1.4% to give a better real total return than cash. Looking at the US market, Goldman Sachs has a series of predictions viewed as cautious, and even they expect a price increase of 3.2% for the S&P 500 next year. With the index yielding 1.6%, that is a total return of 4.8%, or a real return of 1.4% for UK investors (notwithstanding the effect of currency moves).
These are fairly conservative scenarios, and we think the outlook for equities is actually much better. Taking a step back, there is a lot of negativity around the UK economy in the press (and from the Bank) and there are clear signs of slowing. But equities anticipate news, and we think the sell-offs we have seen in equities over the past two years reflect the market adjusting to the expected recessionary impact of inflation. The FTSE 100 is currently trading on a p/e of just 10.7x, according to Bloomberg data, compared to a ten-year average of 15.7x. If we assume a 30% decline in earnings, then the p/e at the end of next year would be exactly 15.7x. In other words, it seems clear to us that a lot of bad news is already in the price. While the US market overall has had a good year, it has been overwhelmingly due to stunning returns in the “magnificent seven” of large-cap tech stocks which are up over 70% each year-to-date. The equal-weighted index is up just 4.7% (in dollars) and has a p/e of just 16.6x compared to an S&P 500 P/E of 20.6x (see table below). So it seems to us there is still plenty of bad news in the price of most US stocks, and therefore scope for good performance if the recession is as expected or less severe than expected.
INDEX VALUATIONS
| FTSE 100 | FTSE 250 | SP500 | SP EQUAL WEIGHT | |
| Month-end P/E | 10.7 | 9.7 | 20.6 | 16.6 |
| 10yr Average | 15.7 | 20.0 | 20.6 | 20.2 |
| Z Score | -1.5 | -1.2 | 0.0 | -1.0 |
Source: Bloomberg, Kepler calculations, as of 31/10/2023
Is this the card you picked?
However, we acknowledge that buying when everyone else is fearful is difficult. Investors who have been hiding in cash or who feel inclined to do so now may want a relatively steady investment to feel comfortable about taking equity risk. Equity income would seem to be a reasonable first step back into the market, with dividend yields around cash rates plus the possibility of price appreciation.
There are plenty to choose from, but with an eye on the potential for capital growth, CT UK Capital and Income (CTUK) seems like an interesting option. CTUK’s portfolio is managed with a growth stock-picking strategy which has seen it significantly overweight the mid-caps. This means the yield is not high for the sector, at around 4.1%, but it also means the capital appreciation potential is higher. UK mid-caps have taken a battering over the past two years, and in this part of the market, the value opportunity is more obvious and arguably the elastic has been stretched. Should we get a mild recession, we think the mid caps could see the greatest relief rally, with the potential for attractive real returns.
Another option close to home would be BlackRock Income and Growth (BRIG). When we spoke to co-manager Adam Avigdori he argued his focus on quality when it came to stock selection could be an advantage in the next few years. A tougher economic environment should see quality companies gain market share, while we seem to have passed the environment in which the growth and value factors are going to drive performance. BRIG also yields around 4.1% and the portfolio tends to have a relatively low beta, with modest gearing bringing it closer to the market.
Looking overseas, STS Global Income and Growth (STS) is managed with a very low volatility style with a focus on the downside, which could appeal to investors looking to get back into equities without taking too much risk. The yield is low, at 2.9%, but the potential for steady capital growth from high-quality businesses is there. The board of STS, which currently has £213m in total assets, has agreed to absorb the assets of Troy Income & Growth (TIGT). TIGT has £167m in total assets, although its shareholders have the option of getting their cash back, so how much will be absorbed remains to be seen. After this combination, STS should be larger, cheaper, and more liquid, which we think would further underline its attractions as a low-risk way to get income and growth from global equities. We think all three trusts have the potential to deliver steady real returns from here which should exceed the real rates achieved on cash.

Disclaimer
Disclosure – Non-substantive Research
This is not substantive investment research or a research recommendation, as it does not constitute substantive research or analysis. With this commentary, Kepler Partners LLP does not intend to influence your investment firm’s behaviour.
Leave a Reply
You must be logged in to post a comment.