Aug
2021
Every which way but loose
DIY Investor
17 August 2021
 We break down the AIC Flexible sector into more useful segments…
This is not substantive investment research or a research recommendation, as it does not constitute substantive research or analysis. This material should be considered as general market commentary.
The AIC Flexible Investment sector is, like a discounted haggis, a simple casing which can house myriad ingredients. In fact, the constituent meats are so exotic that we typically caution it is not a good comparator when discussing relative performance.
The individual trusts that make up the sector often aim to accomplish very different things. Meanwhile the flexible mandates of some of them mean the composition of individual portfolios can vary drastically over time. Below, we have looked at the sector and tried to subdivide it schematically, breaking it down into some broad categories, looking at what each aims to achieve and discussing how this might fit into a broader investment portfolio.
It might give some ideas on how to better benchmark or compare the performance of the individual trusts. We highlight four potential categories: one-stop shops, return-seeking diversifiers, protective diversifiers and hedge fund strategies.
All over the one-stop shop
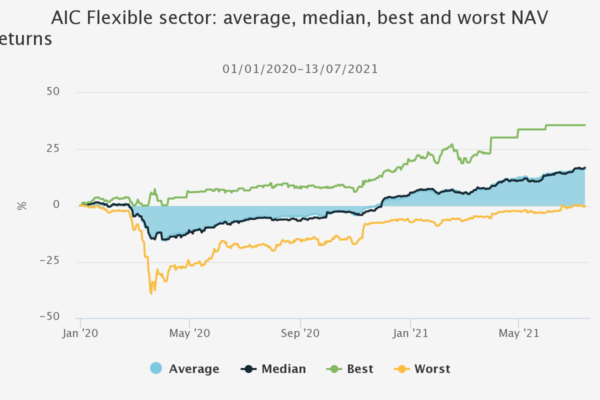
One illustration of the diverse strategies in the sector is the simple divergence of absolute NAV total returns since the start of 2020, covering the market crash of Q1 2020 and subsequent recovery. In the graph below we can see the sector’s unweighted average and median NAV total return, and the best and worst performing trust’s return at any particular point of time.
The close convergence of the median and simple average suggests to us that distributions across the performance spectrum have been relatively equitable. Yet the disparity between the best, worst, and average performers at any one point suggests to us that the sector is clearly not a homogenous blob.
This is most dramatically seen during crisis points such as the initial coronavirus crash in March last year. Here the leading trust in the sector was up during the crash, while the worst performer was down 40%. It is worth noting that not all trusts within this sector report daily NAVs. One example is RIT Capital Partners (RCP), which took over sector leadership in April 2021.
PERFORMANCE OF SECTOR SINCE START OF 2020 (UNWEIGHTED), INCLUDING DISTRIBUTION OF PERFORMANCE (BEST/WORST ON ALL PERIODS)
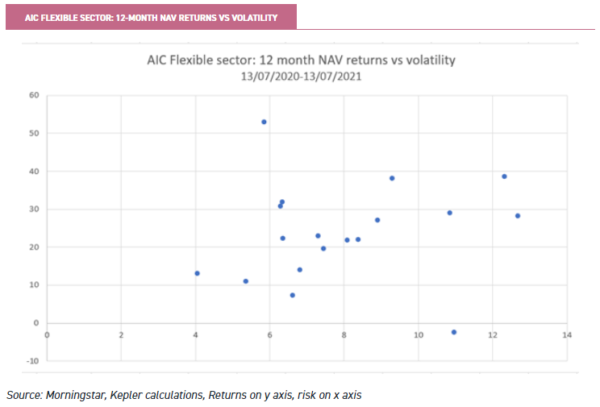
We can see the diversity clearly when we look at risk versus return over the previous 12 months. The distribution in both regards is relatively wide, with little hard correlation between volatility and returns (congratulations to Miton Global Opportunities (MIGO), the notable outlier with the highest NAV total returns and below average volatility).
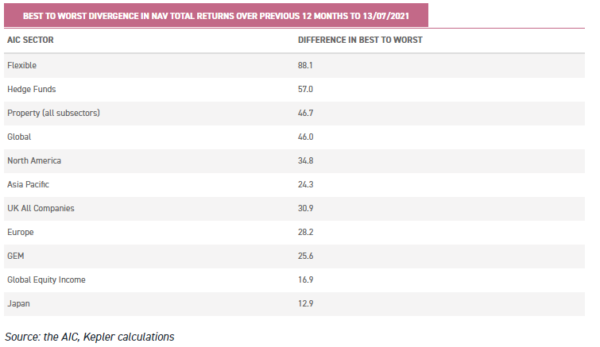
The divergence in the best to worst performers on a NAV total return basis in the Flexible sector over the previous 12 months to 13/07/2021 is notably wider than most other sectors, as we can see in the table below. Within the AIC Flexible sector, the divergence is significantly wider than even other disparate categorisations such as Hedge funds or Property (having grouped together all property subsectors below, this contains a multitude of strategies), whilst region-specific equity markets unsurprisingly show greater convergence of returns.
One-stop shops: 60/40 alternatives
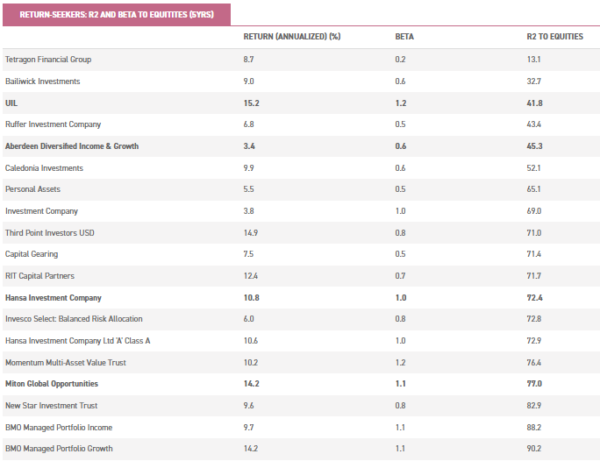
Many, but not all of the strategies contained within the sector could be considered ‘one-stop shops’, designed to serve as a whole portfolio or the core of one. This forms or first broad category. One classic way to structure such a portfolio is with a 60% weighting to global equities and 40% to bonds. We show below the average r2 of trusts with sufficient track record over five years to the Vanguard Life Strategy 60% Equity tracker fund.
This is a good way to start to pick our way through the sector. We would argue a trust with an r2 above 0.8 could be considered a candidate for the role of a 60/40 portfolio, either as a one-stop shop or the core of a broader portfolio (at least based on historic performance). As a reminder, r2 is the correlation squared – so an r2 of 0.8 implies a correlation of 0.89. In the tables below we have highlighted trusts we think are particularly suited as members of the relevant category in bold.
Note – we have also included Third Point Investors (TPOU) in our analysis. TPOU currently sits in the AIC Hedge Fund sector but we view the Third Point’s strategy, applying an opportunistic approach to investing in companies across the capital structure for the best risk-adjusted returns, in keeping with a traditional multi-asset approach to diversification, (even if the trust also incorporates more eclectic hedge fund-esque strategies).
The manager has specialist teams in credit, equity, merger/activist and venture strategies, not to mention a specialist short-selling team and increasingly private investments. In ordinary circumstances we would anticipate asset price appreciation being one of the primary drivers of NAV returns, as opposed to hedge funds that apply a pure alpha approach (such as merger arbitrage or macro trading).
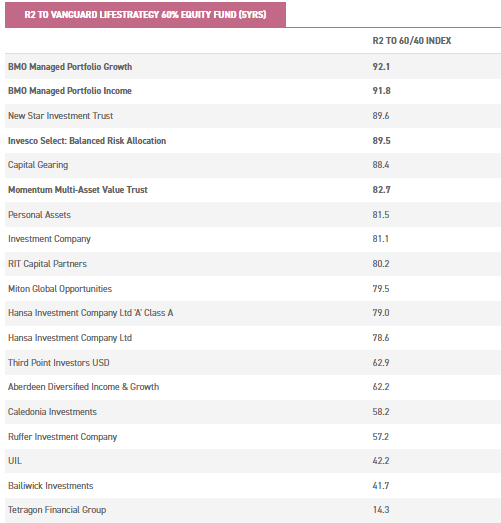
There are many open-ended funds aiming to offer this sort of one-stop shop / core portfolio, but the closed-ended structure offers some significant potential advantages in this area. BMO Managed Portfolio, for instance, utilises a dual share class structure across both an income portfolio, and a growth portfolio (BMPI and BMPG respectively).
This allows the tax-efficient transfer of income received by BMPG to BMPI for capital in return, providing an additional income buffer to the already notable advantage that closed-ended vehicles enjoy over open-ended vehicles in being able to retain some income as revenue reserves for future years distributions.
Such a circumstance (revenue transfer and revenue reserves) could come to be particularly useful to investors should we see a reversal of the previous investment epoch where equities and bonds have tended to exhibit inverse performance characteristics.
Despite the relatively high r2 of both BMPG and BMPI to a traditional 60/40 portfolio, we note that the manager Peter Hewitt is increasingly incorporating alternative assets such as royalties (via Hipgnosis Songs (SONG), for instance) as revenue streams, and this could lead the correlation to be lower in recent years.
Moreover, the flexibility afforded to him in asset allocation means he can shift his portfolio as he deems appropriate. In our previous note, for instance, we noted that he was watching for signs of sustained inflationary pressures as a potential trigger to shift to greater equity exposure to value strategies; in such a scenario, we would also anticipate BMO Managed’s r2 to a 60/40 portfolio falling sharply.
To that point, it is worth considering that the bull market in duration has made allocating to bonds attractive over the past five years. The freedom closed-ended funds have when it comes to finding alternatives to bonds could come in useful if that bull market has ended, leading to higher returns than and lower correlation to a traditional 60/40 portfolio.
The ability to utilise dual-share class structures is not the only benefit that more traditional multi-asset portfolios can enjoy from a closed-ended investment structure. Having a relatively fixed capital structure allows long-term value investors such as the managers of Momentum Multi-Asset Value Trust (MAVT) to access strategies they deem attractive without significant concerns about potential liquidity issues, for example.
In an inherently contrarian, value-based approach, this should allow for greater conviction. In this regard, we note, whilst the MAVT systematically incorporates alternatives into its portfolio, the general asset allocation should in our opinion be expected to align more with a traditional diversified portfolio. And yet the r2 is lower than others we would consider to be similar in systematic multi-asset allocations.
Return-seeking diversifiers
Some of the trusts which have displayed a high correlation to the 60/40 portfolio are also highly correlated to equities and have a high beta (we used the MSC ACWI for this analysis). This is unsurprising given equities make up 60% of the benchmark. Examples are BMO Managed and Momentum Multi Asset Value Trust. Generally, trusts with a high beta to equities could be considered return-seeking.
On the other hand, the sector includes a couple of trusts which can certainly be considered return-seeking, but invest in a broader opportunity set, offering diversification as a result. These include Hansa, UIL and Caledonia.
All have significant positions in individual holdings and something of a family office attitude, with a generally diverse set of assets including private assets. UIL and Hansa stand out as having relatively low r2 to equities but high betas.
Despite the reasonably high correlation to the 60/40 portfolio (just below 0.8), we think Miton Global Opportunities (MIGO) can also be considered a return-seeking diversifier. MIGO is a trust of trusts specialising in deep value opportunities and special situations. The management team of Nick Greenwood and Charlotte Cuthbertson seek to identify pricing inefficiencies within the investment trust market, as well as thematic drivers for discount convergence to the share price.
In practice, this often means buying trusts on deep discounts where there is a catalyst for a significant narrowing of the discount and/or a cyclical or structural change in operating environment. The trust’s best returns are likely to come when markets rally hard as this is when discounts often come in – hence the high beta of 1.1. Aberdeen Diversified Income & Growth may fit in this bucket too: it uses unconventional assets and takes a fund of funds approach in order to generate attractive returns with a low correlation.
Protective diversifiers
For the Flexible sector, a more commonly used and expected return pattern is arguably a protective diversifier fund. Here we think Capital Gearing, Ruffer Investment Company (RICA) and Personal Assets fit; perhaps RIT Capital Partners too. These trusts have displayed a low downside capture ratio to equity markets, meaning that when the market falls they tend to participate in these falls much less. Generally speaking, this goes along with foregoing return potential, although RIT Capital Partners has managed to generate strong returns in recent years with this attractive downside characteristic too.
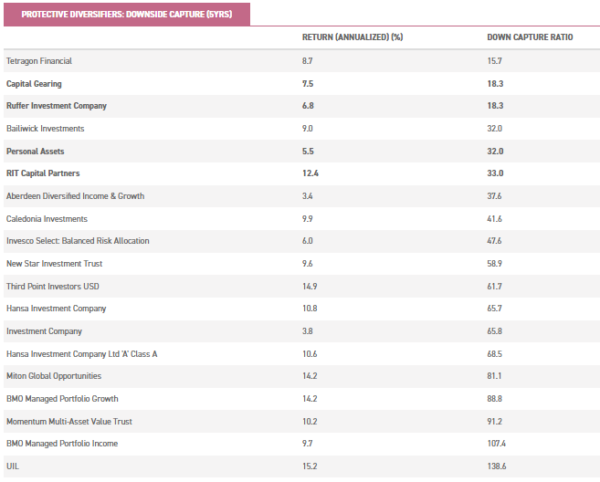
Some vehicles we could consider protective diversifiers have displayed a high r2 to a typical 60/40 diversified portfolio, Personal Assets Trust (PNL) and Capital Gearing Trust (CGT) for example. We would suggest this is perhaps because the nature of the long-term total return equity assets these trusts tend to own will typically display high duration (i.e. relative alignment with positive bond returns), despite the asymmetric inflation hedges the managers of both trusts incorporate into their trusts.
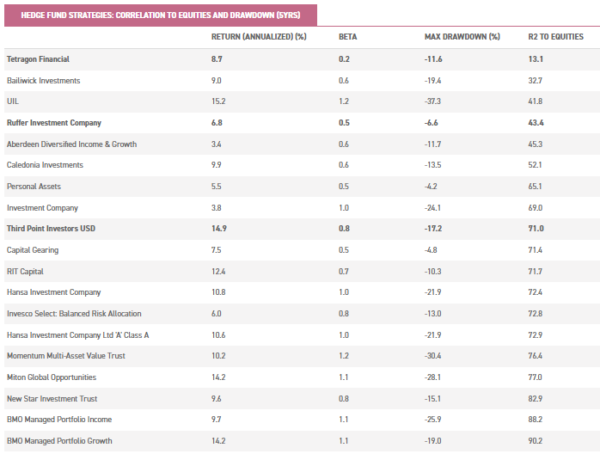
Hedge Fund-esque strategies
The very fluid nature of the Flexible sector (AIC official description: “Invests in a range of asset types”) means that it houses some hedge fund type absolute return strategies. Hedge fund is itself a very broad category. For our purposes this type of fund will typically demonstrate a low correlation to equity markets, a tendency for relatively low drawdowns and an ability to compound over the years to generate reasonable long-term returns.
RICA may fit in this bucket, managed with an absolute return mindset that seeks to balance return-seeking buckets designed to benefit in different environments. The managers are decidedly risk averse. As we saw above, it has also been decidedly more differentiated from a typical 60/40 portfolio than many sector peers.
As we highlighted in our more recent research note on RICA, the trust itself has historically displayed wider distributional return curves than peers with regards changes to inflation expectations (i.e. the fundamentally asymmetric nature that the managers seek to incorporate into portfolio construction has proved effective).
The more convex nature of returns experienced, where greater changes in expected environment have at both ends seen more sizeable improvements to RICA’s relative return profile when compared to its peers, is perhaps testament to its differentiated approach, and can be seen clearly in the graph below.
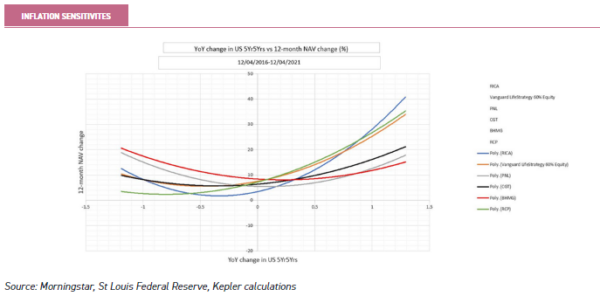
Looking at macroeconomic exposures, we note with interest the common grouping of CGT, PNL, RCP, and RICA as inflation-wary multi-asset trusts. Undoubtedly the managers of each incorporate what they deem hedges to such an outcome, but we note that (as can be seen above) the convexity of these solutions varies significantly.
CGT and PNL, we would suggest, offer more conventional protection (though their index-linked bond holdings should remain highly convex to rapidly rising inflation expectations), whilst the numbers suggest that RCP appears to be more of a conventional multi-asset portfolio.
More obvious members of this hedge fund group include TPOU (which we refer to above, and is not officially a constituent of the Flexible sector) and Tetragon Financial. We note TPOU has generated the second highest returns in the sub-sector over five years, achieving this with a beta of 0.76 and low correlation to both global equities and the 60/40. TPOU offers exposure to Third Point’s flagship master fund which aims to invest in different asset classes to optimise risk and reward through a market cycle. And provide consistent long-term capital appreciation.
Tetragon also has a highly diverse portfolio, investing in a diversified set of alternative assets, including bank loans, real estate, convertible bonds and event-driven equities via hedge funds. The fund’s target is to generate returns on equity of between 10% and 15% per year, which it hasn’t quite managed over the past five years as the table below shows, but has shown a very low correlation to equities.
Conclusion
The AIC Flexible sector includes a multitude of strategies. We think the above analysis shows that there are a number of different clusters of funds within the sector, comparisons within which can aid performance evaluation and understanding.
That said, these clusters frequently overlap. Certainly, we think we have demonstrated a simple sector average is not a useful comparator, and one of our sub-groups will likely make more sense for investors assessing historical performance and positioning. It is also important to note that many of the trusts in this sector are run by managers with a highly flexible mandate.
This will likely lead to swings in correlations over time, significantly more so than with more stable constrained investment strategies, such that this oft repeated phrase – past performance may not be a reliable indicator of future performance – is certain to be the case for these trusts.
Past performance is not a reliable indicator of future results. The value of investments can fall as well as rise and you may get back less than you invested when you decide to sell your investments. It is strongly recommended that Independent financial advice should be taken before entering into any financial transaction.
The information provided on this website is not intended for distribution to, or use by, any person or entity in any jurisdiction or country where such distribution or use would be contrary to law or regulation or which would subject Kepler Partners LLP to any registration requirement within such jurisdiction or country. In particular, this website is exclusively for non-US Persons. Persons who access this information are required to inform themselves and to comply with any such restrictions.
The information contained in this website is not intended to constitute, and should not be construed as, investment advice. No representation or warranty, express or implied, is given by any person as to the accuracy or completeness of the information and no responsibility or liability is accepted for the accuracy or sufficiency of any of the information, for any errors, omissions or misstatements, negligent or otherwise. Any views and opinions, whilst given in good faith, are subject to change without notice.
This is not an official confirmation of terms and is not a recommendation, offer or solicitation to buy or sell or take any action in relation to any investment mentioned herein. Any prices or quotations contained herein are indicative only.
Kepler Partners LLP (including its partners, employees and representatives) or a connected person may have positions in or options on the securities detailed in this report, and may buy, sell or offer to purchase or sell such securities from time to time, but will at all times be subject to restrictions imposed by the firm’s internal rules. A copy of the firm’s Conflict of Interest policy is available on request.
PLEASE SEE ALSO OUR TERMS AND CONDITIONS
Kepler Partners LLP is authorised and regulated by the Financial Conduct Authority (FRN 480590), registered in England and Wales at 9/10 Savile Row, London W1S 3PF with registered number OC334771.
Leave a Reply
You must be logged in to post a comment.