Jan
2024
Definitely maybe
DIY Investor
12 January 2024
Fund flows and discounts could shed some light on a once in a lifetime opportunity…by Nicholas Todd
We think 2024 is starting with a new sense of optimism in the air, as the prospect of easing macroeconomic conditions is on the horizon. Last year was a difficult one for many investors, at least until the fourth-quarter rally. Rising interest rates created incentives to shift into cash, and this led to a significant widening of discounts on investment trusts. However, markets performed strongly at the end of the year. With expectations rising for rate cuts sooner rather than later, and any recessionary forces looking weak, the picture for financial assets is arguably brighter than it was last January.
Here we look at how investors responded to the uncertainty enveloping markets in 2023 by analysing the evolution of asset flows. We set out to see how open-ended fund flows compared to discount moves in the closed-ended universe, and where the sector stands. We think the analysis highlights some potential opportunities in cheap sectors.
Open-ended fund flows
Investment Association (IA) data on fund flows is only available up to the end of October. This is actually a pretty useful period to look at, as in the last couple of months of 2023 markets rebounded quite significantly. Up until this point, the data paints a bleak picture for the majority of IA sectors with retail and institutional investors redeeming £37bn over this time. As the table below shows, the UK All Companies and Europe (ex. UK) sectors experienced the most significant outflows over the period in absolute terms, with outflows of £9.2bn and £2bn respectively. This equated to 6.5% and 3.5% of funds under management (FUM) in the sectors at the start of 2023. As a percentage of FUM, the worst-hit sectors were healthcare and financials and financial innovation. Very few sectors saw net inflows, notably the global and global equity income sectors.
TOTAL SECTOR FUND FLOWS
| IA SECTOR | TOTAL ASSET FLOW JAN 23 – OCT 23 (£M) | TOTAL FUM OCT 23 (£BN) | % CHANGE FROM START OF 2023 |
| UK All Companies | -9,179 | 131.7 | -6.5 |
| Europe excluding UK | -1,966 | 55 | -3.5 |
| UK Equity Income | -1,889 | 33.6 | -5.3 |
| UK Smaller Companies | -878 | 9.2 | -8.7 |
| Healthcare | -763 | 24.6 | -2.9 |
| Specialist (equity) | -735 | 24.6 | -2.9 |
| North America | -618 | 81.7 | -0.8 |
| Financials and Financial Innovation | -383 | 2.3 | -14.3 |
| Global Emerging Markets | -336 | 32.2 | -1.0 |
| European Smaller Companies | -210 | 1.7 | -11.0 |
| China/Greater China | -178 | 2 | -8.2 |
| European including UK | -45 | 2.7 | -1.6 |
| Asia Pacific including Japan | -42 | 0.8 | -5.0 |
| Japanese Smaller Companies | -40 | – | – |
| Latin America | -28 | 0.3 | -8.5 |
| North American Smaller Companies | -5 | 4 | -0.1 |
| Technology and Technology Innovation | 25 | 7.1 | 0.4 |
| Asia Pacific excluding Japan | 124 | 32.2 | 0.4 |
| India/Indian Subcontinent | 152 | 4.2 | 3.8 |
| Japan | 271 | 21.8 | 1.3 |
| Global Equity Income | 774 | 22.2 | 3.6 |
| Global | 814 | 163.2 | 0.5 |
| Unclassified Sector | 1,406 | – | – |
Source: Investment Association, Kepler calculations, as of 31/10/2023
We think much of this likely came from the UK sectors, all of which experienced significant outflows from retail investors. A lot of this we would attribute to the sharp rise in interest rates used to combat inflation. High rates on virtually risk-free cash and short-term bonds were tempting, particularly as fears of a significant recession persisted through the year. However, negativity about the UK’s prospects was pretty extreme throughout the year, and we think many investors will have looked to the global sectors instead. Although it is reflected in the outflows of the UK All Companies sector the impact has been felt hardest in the UK Smaller Companies sector, with assets down over 8%. We would argue that funds have been caught up in this trade with little regard for the strength of their portfolios. The extent to which the UK has been out of favour is shown through total outflows which didn’t show any sign of easing through the course of the year—a total of £11.9bn. To put this into perspective, the second greatest outflows came from European equities which if we include smaller companies experienced just over £2.2bn of outflows.
European equities faced another challenging year with higher energy prices and supply chain constraints adding to a tough macroeconomic backdrop. The sector experienced the worst outflows in over a year during September and October 2023. As with the UK, the smaller companies sector was hit hardest with outflows equating to 11% of FUM at the start of the year. Overall, it has been unsurprising that investors moved away from more volatile assets with greater interest rate sensitivity, such as equities and property into more secure fixed income and money market products offering higher yield than medium- or long-term bonds (upwards of 5% risk-free), as highlighted in the table below. Alternative investments also suffered as a consequence of rising interest rates and rising costs of debt. This has been true, particularly for commercial property, which has continued to suffer from the persistent impact of hybrid working.
ASSET CLASS FLOWS
| ASSET CLASS | TOTAL ASSET FLOW JAN 23 – OCT 23 (£M) |
| Mixed Asset (excl. Flexible Investment and unallocated) | -4,219 |
| Equity | -3,678 |
| Flexible Investment | -1,422 |
| Property | -460 |
| Others | 220 |
| Money Markets | 1,107 |
| Fixed Income | 4,537 |
Source: Investment Association, Kepler calculations, as of 31/10/2023
Global Emerging Markets experienced strong inflows in the first half of the year. However, this reverted to outflows in the second half of the year. We believe this reflects investors looking to play a China reopening which disappointed, and then selling when the story changed. China faces a number of headwinds: regulatory uncertainties and the potential threats of government interventions along with elevated levels of geopolitical tensions are issues. Combined with the impact of deglobalisation and reshoring of manufacturing and the continued focus on sustainability this is having a negative impact on sentiment. The opposite is true with India. Since March 2023, the sector has experienced month-on-month inflows as investors look to the country’s growth story, driven digital transformation, the proactive approach taken by the government, its deep domestic capital market, and the ever-growing middle class.
MONTHLY FLOWS
| IA SECTOR | JAN-23 | FEB-23 | MAR-23 | APR-23 | MAY-23 | JUN-23 | JUL-23 | AUG-23 | SEP-23 | OCT-23 | TOTAL ASSET FLOW JAN 23 – OCT 23 (£M) | TOTAL FUM OCT 23 (£BN) | % CHANGE FROM START OF 2023 |
| Financials and Financial Innovation | -14 | -268 | -31 | 7 | -18 | -30 | 1 | -16 | -29 | 15 | -383 | 2.3 | -14.3 |
| Global Emerging Markets | -2 | -88 | 284 | 45 | 102 | -2 | -10 | -107 | -172 | -386 | -336 | 32.2 | -1.0 |
| India/Indian Subcontinent | -30 | -2 | 8 | 5 | 8 | 2 | 30 | 24 | 74 | 13 | 152 | 4.2 | 3.8 |
Source: Investment Association, Kepler calculations, as of 31/10/2023
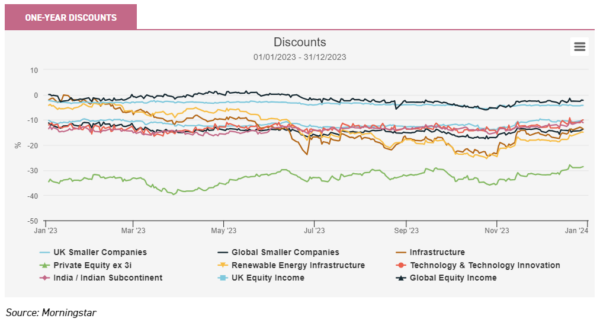
Discounts
The picture of outflows at the top level is mirrored in widening discounts in the investment trust space. After 2022 which saw discounts widen from 2.2% to 11.8%, by 30/10/2023 they had moved out further to 17.3%—the widest level since the global financial crisis. We believe this may have presented a great opportunity for long-term investors—particularly in the hardest-hit sectors.
At the sector level, there were some similar patterns to the asset flows of their open-ended equivalents. The UK All Companies and UK Smaller Companies sectors saw their discounts widen from 10.2% to c. 14% as of October 2023. This has come despite many trusts delivering positive NAV returns. This includes Aberforth Smaller Companies (ASL), BlackRock Throgmorton Trust (THRG), and JPMorgan UK Smaller Companies (JMI) which have delivered a return of 8.2%, 6.8%, and 7.5% respectively compared to 0.4% generated by the FTSE All-Share over 2023. In addition, China-focussed strategies discounts have also widened from 9.5% to c. 14% during the year—wider than that seen by global emerging markets trusts which will have a less concentrated allocation to China.
The significant outflows from interest rate sensitive, debt-heavy sectors such as property, have been replicated in the widening of discounts across the closed-ended infrastructure and renewable energy infrastructure sectors over the year. In a similar vein to smaller companies, we believe there are opportunities for investors that can identify higher-quality investment opportunities within these sectors including 3i Infrastructure (3IN) and Pantheon Infrastructure (PINT) which have delivered NAV returns of 11.6% and 9.9% over the year but are trading at discounts of 9.4% and 20.5% respectively. This is in addition to renewable energy infrastructure strategies such as Greencoat UK Wind (UKW) which is trading on a 10% discount and offers a high dividend yield linked to UK RPI.
However, some strategies have bucked the trend. For example, the global equity income sector has reflected the stability in terms of open-ended asset flows with its more stable discount, thanks to trusts such as Invesco Select Global Equity Income (IVPG) and JPMorgan Global Growth and Income (JGGI). However, the UK equity income sector has also managed to maintain a relatively stable discount averaging 3.6% despite experiencing the third worst sector outflows over the year. We believe this reflects the higher demand for income strategies that provide higher dividends with revenue reserves providing longer-term security, alongside capital growth which can be boosted by gearing.
We also note that the open-ended India sector saw consistent inflows of assets over 2023, however, the closed-ended sector has only seen the discount come in to 11.1% compared to 13.5% at the start of the year. Only one trust currently trades at a premium in the sector – Ashoka India Equity (AIE). The larger trusts in the sector have seen disappointing performance in recent years, which we believe has weighed on the discount. However, this provides an opportunity, particularly if active performance turns around. Indeed, Nick Greenwood, manager of MIGO Opportunities (MIGO) and now part of the Asset Value Investors stable, flags JPMorgan Indian (JII) as interesting in this regard. There is a new management team in charge, and tender offers are on the horizon. Finally, whilst there were inflows into open-ended tech funds in the second half of 2023, the discount of the AIC technology and technology innovation sector has remained stubbornly wide, at 10%. Given the long-term structural supports for the tech sector, we think this is a striking opportunity to gain exposure to some of the world’s most innovative companies through trusts such as Allianz Technology Trust (ATT).
As mentioned above, October 2023 marked a turning point in markets where slowing inflation has led to a broad-based rally with the S&P 500 generating a return of 12.2%, and bonds represented by the iShares Government/Credit Bond ETF generating 7.9% as of 31/12/2023. This included a recovery in some more interest rate sensitive growth areas of the market. Even though Fed chair, Jerome Powell, said the central bank was “not thinking about rate cuts right now”, investors have shown some signs of cautious optimism. November Fund flows data from Calastone showed that a less uncertain market environment prompted a cautious return to inflows for some sectors adding back around 10% of the £4.54bn in outflows seen across a six-month period of net selling. This included flows into emerging markets, North America, and global mandates, whilst a sustained decline in bond yields saw an increased flow of capital into fixed income. That said, investors remain cautious and money market funds saw double the inflows to fixed income in November. In addition, infrastructure, Asia Pacific, Europe, and the UK continued to see outflows, albeit at a less severe pace.
This is also reflected in the quick narrowing of discounts of certain sectors, narrowing the average of the universe to 14.8%. This has been particularly evident in the interest rate sensitive areas of the market such as infrastructure sectors and the commercial, logistics, and healthcare property sectors which have effectively halved their discounts from c. 30% to 18%—we also note that logistics and healthcare traded at a premium pre-Q2 2022. Similarly, the discounts in the private equity sector (excl. 3i) have also narrowed since then to 28.6% versus 40% at the end of March 2023. In addition, there has been a slight narrowing of the UK and North American smaller companies sectors however, they still trade on a 10% and 9% discount respectively.
Conclusion
Investors have taken 2023 as an opportunity to reevaluate their investment portfolios and take money out of riskier areas of the market as higher rates of return have been offered by a more diverse range of assets. However, we think the fact that the discounts across some of these sectors are beginning to narrow, may reflect the beginning of a shift in investor sentiment. Interestingly, this initial move has come from sectors yet to see inflows recover. We think this may suggest we could be coming out of a period of overdone selling pressure, which over the near term may provide an opportune entry point for investors to gain a powerful addition to returns through NAV upside and the narrowing of discounted investment trusts. When veteran trust of trust portfolio managers Nick Greenwood, MIGO, and Peter Hewitt, CT Global Managed Portfolio (CMPG), have both noted that the level of investment trust discounts may present a ‘once-in-a-generation opportunity’, who are we to argue with that?

Disclaimer
This is not substantive investment research or a research recommendation, as it does not constitute substantive research or analysis. This material should be considered as general market commentary.
Brokers Commentary » Commentary » Investment trusts Commentary » Investment trusts Latest » Latest » Mutual funds Commentary
Leave a Reply
You must be logged in to post a comment.