Jan
2023
Cry havoc!
DIY Investor
11 January 2023
Lessons from a year in which an already troubled world was savaged by the dogs of war…by William Heathcoat Amory
Each generation seeks to learn from the mistakes of previous generations. However, events rarely play out exactly as they have in the past. Whilst history doesn’t repeat, it does rhyme. The same might be said of stock market cycles. But it’s fair to assume (hope…) that the uniquely unfortunate set of circumstances we have experienced so far in 2022 are unlikely to recur.
Companies and markets are still adjusting to many great shocks, including Brexit, Covid, a reverse in globalisation, war in Europe, galloping inflation and political uncertainty from polarised electorates in the US and Europe, including the UK.
Given the circumstances, it is not surprising that investor sentiment is at a low ebb and, consequently, discounts to NAV across the entire investment trust sector have widened considerably. In some cases, this will have added insult to injury, given the fact that many trust managers have been wrong-footed by how events have transpired this year.
Very high valuations of growth stocks, together with a preponderance for growth versus value strategies in the trust sector, not to mention gearing and perhaps too much ‘home bias’ in a period in which sterling has been very weak, have all led to a disappointing period for many trusts, whatever their sector.
Every trust has its own very specific reasons for the level of the discount but, in our view, it is not surprising that discounts have widened generally. Clearly ‘risk-off’ sentiment has been a major driver, but are there any other broad characteristics that have contributed to discounts widening? Are there lessons to be learnt from this year’s rather miserable test case?
And if discounts have widened for particular subsets of trusts, then perhaps these are the places to focus on for the rebound? If market conditions return somewhere towards the norm, then it might be expected that these trusts will see their discounts narrow more than the rest, providing a useful accelerant to NAV returns.
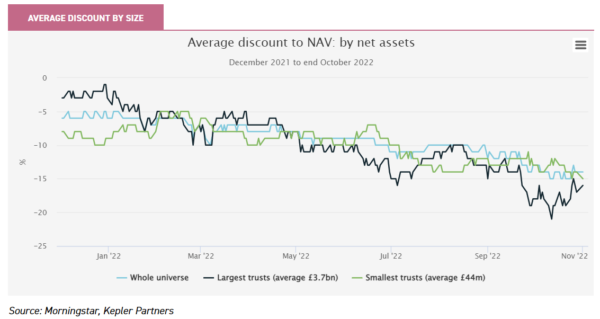
In order to look at this further, we consider a variety of ex-ante and ex-post factors and screen the investment trust universe for trusts with these characteristics, comparing the experience of those at either end of the spectrum to see if we can gain any insight into the drivers behind significant discount widening. First up, we look at the biggest and smallest trusts in terms of net assets.
In the graph below, we show the simple average discount to NAV of the largest decile of trusts in the universe, which have an average market cap of £3.7bn, compared to the average discount of the smallest decile of trusts in the universe, which have an average market cap of £44m. The average of the entire sector is set alongside as a comparator.
Perhaps contrary to what one might have expected, the largest trusts in the universe have seen discounts widen most dramatically, with the smallest trusts in the sector actually performing ahead of the average for the sector in discount terms. At the start of the year, we would have been confident in predicting that in a market fall, trusts with the most liquid shares would be less badly punished by negative investor sentiment or a lack of market liquidity.
Perhaps this has something to do with their starting point, given that the largest trusts in the sector started the year at relatively narrow discounts? Below, we examine this factor as an explanation for discounts widening further, but first turn our attention to another way of looking at liquidity, i.e. which of the UK’s FTSE indices a trust belongs to.
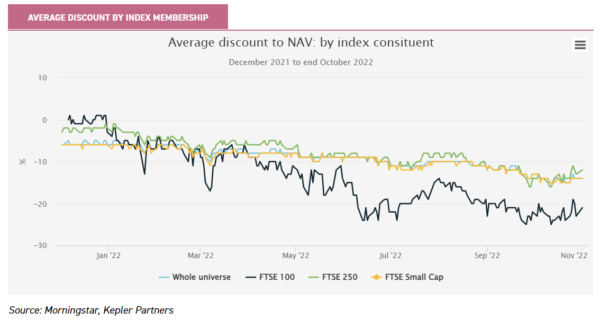
In the graph below we show the same analysis, but this time with the average discount of the constituents of the FTSE 100, the FTSE 250 and the FTSE Small Cap Indices. Immediately obvious is the exceptionally poor showing of the members of the FTSE 100 Index relative to the other constituents and the average for the sector as a whole. However, also discernible is that the constituents of the FTSE 250 Index have maintained their slight premium rating to the average.
So, what’s going on? In our view, when institutional investors are making big strategic shifts in their portfolio, size really does matter. When one reads that an institutional investor is “reducing our weighting in UK equities and buying US inflation-linked bonds” for example, the fund manager making that decision probably won’t be going through the portfolio line by line, they just want to reduce the overall exposure to equities as soon as possible.
The most likely outcome is that a basket of FTSE 100 Index equities will be sold, either for cash or through a derivatives’ contract. Either way, at the end of the chain someone is selling shares in FTSE 100 Index equities. So, when markets enter a very strong ‘risk off’ phase, FTSE 100 Index equities are sold first. The corollary of this is that very small company equities can exhibit lower volatility in ‘risk off’ phases.
This is counterintuitive if one believes that smaller companies are inherently riskier, but it is simply because during such phases of the market there are few investors who operate in the manner described above who own smaller company shares. So, when institutional investors turn ‘risk off’, the handful of investment trusts in the FTSE 100 Index will find themselves swept along with this.
On top of that, FTSE 100 and FTSE 250 Indices’ constituents are quite exposed to more conventional passive index funds. A passive fund is, fundamentally, just a basket of equities as described above.
So, it’s quite likely that passive fund redemptions will also occur in ‘risk off’ phases because there will be investors who just want to reduce their equity exposure quickly and efficiently. Finally, the small number of FTSE 100 Index investment trusts are quite growth-orientated in nature and, once again, ‘risk off’ has been particularly detrimental to growth trusts.
Conversely, a number of the FTSE 250 Index investment trusts are more defensive in nature, for example the big infrastructure and renewable energy infrastructure trusts. In our view, this last point is probably the most important explanation for the difference in discount movements between FTSE 100 and FTSE 250 Indices’ investment trusts.
The opposite is, of course, also true: in more positive markets, more money will flow into FTSE 100 and FTSE 250 Indices’ equities. We believe that this is a contributory factor to the good price ratings that the larger investment trusts have experienced in recent years.
Let’s not forget that being large is very likely to be a result of a successful investment strategy and no one should underestimate this as being a factor in long-term average discounts. But, essentially, what we are saying is that the larger an investment trust is, or indeed any listed company, the more its share price is susceptible to the shorter-term ebb and flow of markets.
A return to ‘risk on’ would most likely see the larger investment trusts experience discount narrowing. Of the FTSE 100 Index investment trust constituents, namely Scottish Mortgage (SMT), 3i Infrastructure (3IN) and Pershing Square (PSH), in terms of portfolio concentration, Scottish Mortgage is least exposed to company-specifics of the three and, as such, the discount to NAV which has at times been in the high teens, may prove attractive for those with a long-term perspective.
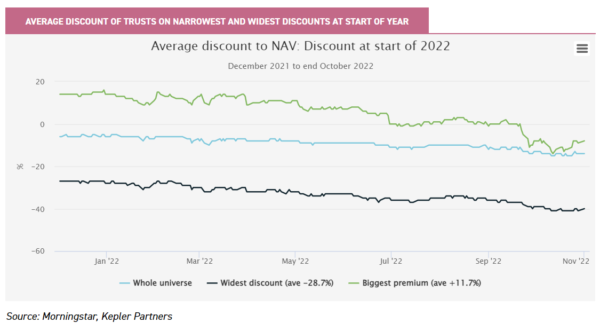
Perhaps this is more to do with where discounts have started from? It has long been our view that significant premia to NAV are to be avoided at all times, particularly for trusts with liquid underlying holdings and easily-determined market valuations.
In our view, other than for alternative assets where valuations may be conservative or the trust may justify a portfolio premium to reflect the difficulty of building up a diversified portfolio of assets, any premium to NAV in excess of 2% or 3% is likely to prove unsustainable. The mechanics of buybacks would indicate that a discount to NAV offers, potentially, asymmetric upside, with the board minimising further downside risk, but the shares can trade up to or in excess of the NAV.
On the other hand, when buying shares on a premium, there is asymmetric downside in our view, with the board unable to buy shares back and protect the share price rating until there is actually a discount.
In the graph below, we show the top decile of trusts which had the highest premia at the start of the year, taking the one-month average at the end of 2021. We see that our long-running thesis on buying shares at a premium holds true, with those trusts most in demand at the start of the year falling hardest as broad sentiment collapsed.
An average premium to NAV of 14% at the start of the year gave way to an average discount of 8%, representing a 22% fall from grace. On average, discounts have widened by 8% over the year to the end of October, from c. 6% to 14%.
By contrast, those trusts on wide discounts at the start of the year fell from 27% to 40% on average, a 13% fall. Aside from avoiding premia, we think that the lesson here is that a wide discount will protect investors to some extent, but perhaps the safest place to be is the middle of the road in terms of sector discounts. The quality of a trust, rather than deep value (discounts) or popularity (premia), perhaps, is the safest place from a discount perspective.
Of those that have fallen from the highest premia, perhaps there are some potential jewels out there? Within the commercial property sector, there is plenty of uncertainty on valuations in this new, higher interest rate environment.
However, Tritax BigBox REIT (BBOX) which was a high-flying trust in a popular area of the commercial property market has gone from having traded at a premium of 30% to a discount to NAV of 40% at the end of October 2022. BBOX is at the specialist end of the market, which clearly brings its own risks, but the de-rating this year has been swift. On the other hand, BH Macro (BHMG) started the year at a premium of 10%, has seen its performance this year burnish its credentials such that the premium, as at the end of October, had actually increased to 13%.
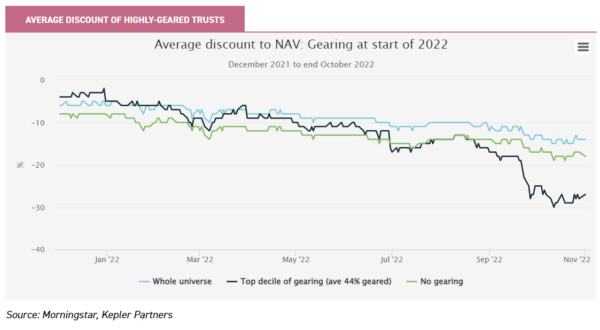
Gearing, in a ‘risk off’ environment, starts to be seen as a less attractive feature. In the graph below, we show that, as one might expect, those trusts which had the highest gearing at the start of the year saw their discounts widen dramatically in September.
Before this, there was no effect and we compare the most highly-geared trusts to those with no balance sheet gearing. It is only since the Kwasi-crumble of bond yields that discounts made themselves apparent. Rising interest rates will have permanent scars, but if there is stabilisation of the UK’s finances under Jeremy Hunt, perhaps there will be diamonds in the discount rubble here?
That said, as we highlighted in this article, investors need to be cognisant of a whole range of issues with debt that may not have been on the radar for over a decade.
Amongst the most geared trusts at the start of the year, Hipgnosis Songs (SONG) saw its discount widen significantly from a premium to NAV of 2% at the start of the year to a discount, according to Morningstar, of 42% at the end of October. As we have highlighted, SONG has now, largely, fixed its interest rate exposure and its portfolio of globally-significant songs does not, in our view, warrant such a wide discount. We hope that the company’s capital markets day in mid-December will illustrate a rebound in performance revenues, as well as continued strength in streaming.
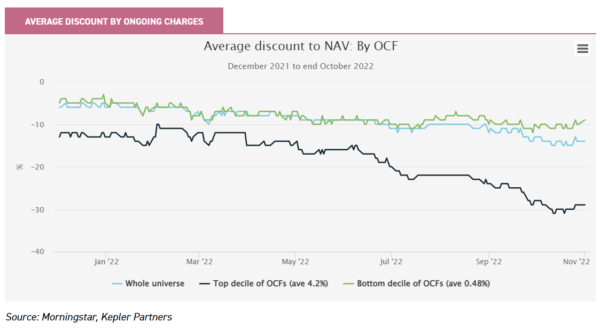
The graph below shows very visibly that trusts which have the highest charges have seen their discounts widen very significantly compared to the average or those trusts with the lowest charges. Again, this is not outside of what one might have predicted, but is interesting nonetheless.
In our view, it is important to remember that NAV total returns are always quoted after the impact of charges. And as such, if a trust compounds at a higher rate than a trust with low charges, then it makes no sense to prefer the trust with lower charges.
A case in point is the listed private equity sector, which not only has high charges in absolute and relative terms, but also has outperformed broad equity markets consistently over the last decade. In our view, the lack of interest from those who obsess about headline charges offers investors an opportunity to own high-quality assets at a bargain basement price, as the graph below illustrates so well.
We have written recent notes on ICG Enterprise Trust (ICGT) and NB Private Equity Partners (NBPE), highlighting what we see as the significant value on offer at these discount levels. Trusts, including CT Private Equity (CTPE), continue to see meaningful realisations of portfolio companies at premiums to NAV. This indicates that despite market volatility and the challenging economic backdrop, transactions are still happening and at valuations significantly ahead of those implied in NAVs.
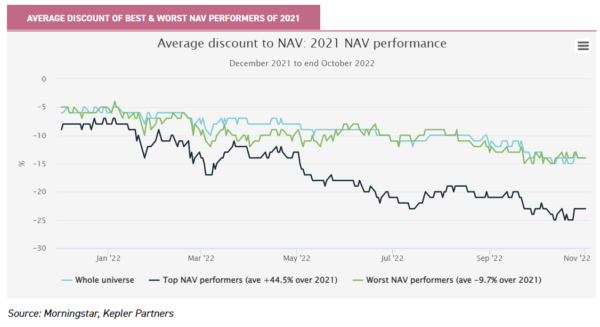
The phrase ‘what goes up, must come down’, is well known and has many applications. The graph below suggests that it applies to investment trusts too. We have plotted the top decile NAV performers during 2021 and show that it is these that have seen amongst the biggest falls from grace.
The average discount of the top guns of 2021 has fallen from 8% at the start of the year, to 24%, currently. Middlefield Canadian Income (MCT) and Schroder UK Public Private (SUPP) both feature in the best performers’ table of 2021 in NAV terms, yet both have seen their discounts widen significantly during 2022 year to date, despite their portfolios seemingly being well-equipped to deal with the current challenging economic environment.
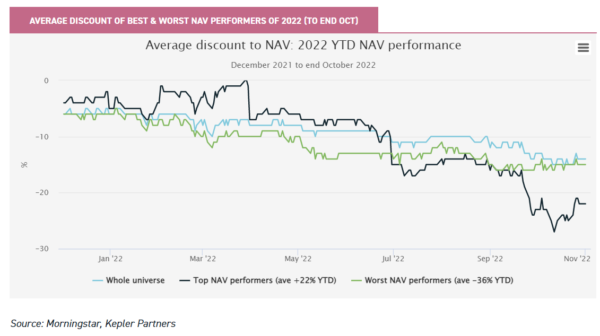
The graph below gives entirely the opposite result that we might have predicted. According to our analysis, those trusts that have performed the best for the year to date have seen their discounts widen the most. We believe there are potentially two similar, but related, reasons for this. Firstly, for trusts with private assets, the time lags of their NAVs being reported will make their performance seem better than those exposed to daily-priced assets which have fallen in value.
Or, there is an element of disbelief in these NAVs, with the market discounting falls in the future which, all things being equal, would narrow discounts once again. The second is that sterling’s weakness against the US dollar has been a particular feature of markets, year to date, which has propped up NAVs. In our experience, investors, particularly in current markets, do not ‘give credit’ for NAV movements driven by short-term movements in currency markets.
As has been the experience recently, GBP has re-bounded strongly against the USD, meaning that discounts have narrowed once again all things being equal, i.e. share prices have stayed the same, but sterling NAVs have fallen as GBP has strengthened.
We can see this picked up in the graph below, where discounts started to narrow for these trusts on 18th October, when GBP started to strengthen. Oakley Capital (OCI) is one trust we think worth highlighting, delivering a strong performance driven by resilient operating performance from underlying companies and some realisations year to date, yet the discount to NAV has widened from c. 15%, according to Morningstar, to 41% at the end of October.
TRIG – Renewables Infrastructure Group (TRIG) also features in the best performers year to date, yet the premium of 17% at the start of the year has given way to a discount of 3% – a potential opportunity for long-term investors?
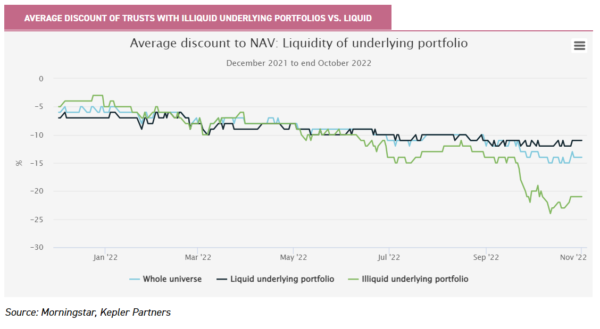
This point about illiquid portfolios repeats in the graph below, in which we have plotted the average discount of those trusts with illiquid underlying holdings, by which we define as not being traded on an exchange.
It is interesting to note that on average they started the year in a similar place as those with liquid underlying portfolios but, by the end of October, the discounts for trusts with exposure to illiquid assets had widened considerably. The points we make above clearly relate here, but we would add further that in our experience, those trusts with opaque or hard-to-value assets do not tend to do well in discount terms when the tide goes out.
Taylor Maritime (TMI) is a classic case in point which, despite having IPO’d in May 2021, has seen its discount widen to c. 35%, despite a strong performance in NAV terms. As an owner of handysize cargo ships, the managers argue that an industry supply shortfall of this type of ship over the medium term should protect TMI from the inherent cyclicality of the shipping industry by creating pricing pressure on ships and charters until at least 2024, subject to new supply coming onstream.
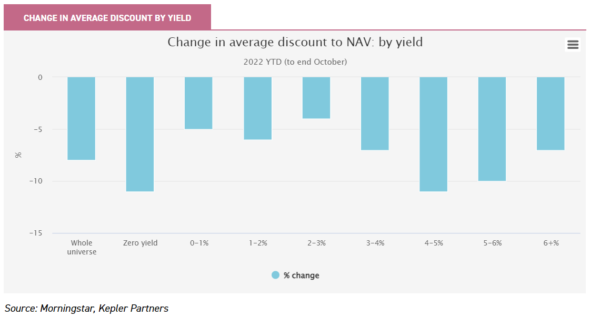
In the chart below, we show what happened to average discounts, depending on what the share price yield was at the start of the year. We have determined eight bands, given the range of strategies and asset classes that exist within the trust universe and, therefore, the difficulty of determining what a ‘high’ yield might be. All things are relative.
Prior to doing this analysis, our expectation would have been that a higher yield would protect discounts from widening out more than those which had a low or no yield. What we discover is that during 2022 this was only partly true. As we rise up the yield spectrum, it would appear that the prospect of high dividends in the future provides less protection.
Trusts with yields of between 4% and 5% offered no protection over those trusts which offered no yield. Trusts with yields that were higher than 5% experienced slightly less discount widening, but offered less protection than those of below 3%.
Perhaps here we can see the safety of sticking to the ‘middle road’. Higher yields may be perceived in times of market stress as being higher risk, which, in turn, may be a reason for discounts widening at this end of the spectrum.
Conclusion
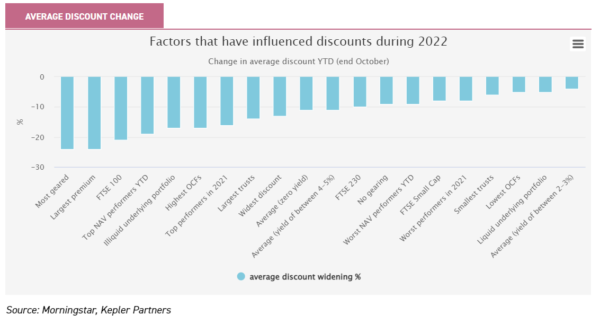
The graph below illustrates all of the different factors we have examined in the analysis above, arranged left to right by those factors that have seen the largest widening of discounts. Surprising, in our view, is how far the FTSE 100 Index constituents have fallen.
However, given that there are only three of them, perhaps this is more to do with specifics and less relevant for ‘next time’. However, should your grandchildren, born already or not, ever ask you what the lessons from 2022 were, we would advise the perennial warnings of avoiding trusts with significant gearing and those with premia to NAV.
Illiquid underlying portfolios do look like they have seen discounts widen significantly, but the truth will out only over the medium term, once NAVs have had a chance to adjust. The fact that it is the top performers this year and last that have suffered amongst the worst in discount terms would indicate to us that it always pays to rebalance portfolios periodically: nothing, especially performance, lasts forever. In our view, the most surprising result is how large trusts have suffered in discount terms more than small trusts.
A recurring theme from the examination of these results is that, in discount terms, it is probably safest to channel Tony Blair when you are picking trusts. That is, choosing those at neither extremes of any spectrum and remaining in the middle ground of popularity, gearing, illiquidity or cost.
Exposure at either ends of the spectrum can offer opportunities, but in a sudden and broad downturn in sentiment, our analysis suggests that these trusts tend to get shot down first in discount terms.

Disclaimer
This is not substantive investment research or a research recommendation, as it does not constitute substantive research or analysis. This material should be considered as general market commentary.
Brokers Commentary » Commentary » Investment trusts Commentary » Investment trusts Latest » Latest » Mutual funds Commentary
Leave a Reply
You must be logged in to post a comment.