Jul
2024
Could UK mid-sized companies be about to reverse a topsy-turvy decade of underperformance?
DIY Investor
7 July 2024
Like Mr. Topsy-Turvy from the best-selling Mr Men books, the UK equity market has been performing in a funny sort of way – by Graham Ashby
The UK equity market has similarities to Mr. Topsy-Turvy from the best-selling Mr Men books by Roger Hargreaves. The description of Mr. Topsy-Turvy certainly chimes with unusual behaviour we’ve been seeing from UK equities. Hargreaves describes him as “… a funny sort of fellow. Everything about him is either upside down, or inside out, or back to front – topsy-turvy in fact”.
Please note any past performance mentioned is not a guide to future performance and may not be repeated.
Economic theory states that mid- and small-sized companies are likely to be higher risk and more volatile than large-sized companies. This is because smaller companies tend to be less diversified in terms of numbers of customers and end markets in which they operate.
They can also lack buying power for key input costs and may struggle to play hardball with powerful customers who demand a price discount. Finally, smaller companies often consume more cash as they grow faster (from a lower starting point), have limited channels for funding (e.g. no access to the corporate bond market) and their shares can be less liquid to buy and sell.
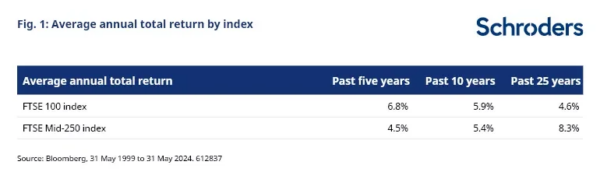
Patient UK equity investors have historically been rewarded for taking on this perception of higher risk. Cumulative returns from the mid-sized companies have been more than three times that from large-sized companies over the past 25 years due to the benefit of compounding (see figure 2, below).
The topsy-turvy nature of the UK equity market is perhaps most clearly illustrated by mid-sized companies in the FTSE Mid-250 index underperforming large-sized companies in the FTSE 100 index. This is very unusual. For example, contrast the average total return over the past five and 10 years with the past 25 years (see figure 2, below).

Please note any past performance mentioned is not a guide to future performance and may not be repeated.
However, this traditional pecking order of the FTSE Mid-250 index outperforming the FTSE 100 index has broken down of late – which begs the questions as to why this has happened, and whether it will likely continue?
Fund flows are the key issue
There has been a significant increase in the number of passively managed portfolios in recent years, first with index trackers and more lately with exchange traded funds (ETFs).
Many of these passive portfolios in the UK seek to replicate the returns from the FTSE All-Share index, with is heavily weighted towards large-sized companies in the FTSE 100. In contrast, actively managed UK portfolios typically invest greater amounts in mid- and small-sized companies and these funds have seen material fund outflows for several years.
These outflows have occurred as domestic investors have sought to gain greater exposure to the boom in US technology companies such as Nvidia, Microsoft and Apple.
Domestic pension funds have also been net sellers of UK equities for some time, buying bonds to better match their liabilities.
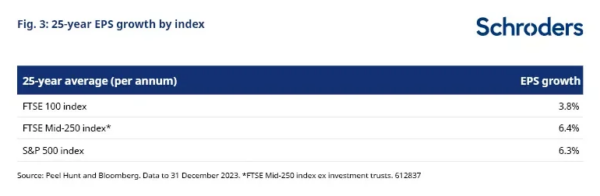
As a result, there has been a significant contraction in valuations. The prospective price to earnings (PE) multiple for the FTSE Mid-250 index is now just 12.9x, compared with a long-run average of 19.7x (covering the 21-year period from April 2003 for which data is available). The S&P 500 index currently trades on a prospective PE of 22.6*.
This is despite a long-term track record of the FTSE Mid-250 index delivering better earnings per share (EPS) growth than the S&P 500 (see figure 3, below).
Please note any past performance mentioned is not a guide to future performance and may not be repeated.
Anecdotal evidence from the US suggests some of these pressures on fund flows are likely to continue. For example, the Harvard Business School** calculates that passive ownership in the US stock market rose to 33% in 2021 and is likely to be even higher now.
Quite what this level of passive ownership does to the long-term efficiency of capital markets is anyone’s guess. Passive investors typically allocate funds to the very largest companies regardless of whether they have a good track record of investing and rarely allocate money towards start-up companies.
Policy makers taking action to address issues
Other investors have been looking to take advantage of current low valuations in UK equities – including overseas corporates, private equity and activist investors. That’s why we have seen a notable pick-up in UK corporate activity, including for logistics company Wincanton, acquired for £754 million in cash, after a bidding war between French-based Ceva and US peer GXO Logistics.
Meanwhile manufacturer/retailer Hotel Chocolat has been acquired for £516 million by privately-owned Mars, at an astonishing 173% premium to its previous market value. There has even been a recent offer for Roger’s namesake, Hargreaves Lansdown (no relation), from a private equity-backed consortium after the company recently got relegated from the FTSE 100 to the FTSE Mid-250 index.
At the time, Hargreaves Lansdown was trading at just 755p per share and, after rejecting the offer and then recommending a second revised offer it is currently around 50% higher and was recently re-promoted to the FTSE 100 index.
Activist investors have also been increasingly prominent in recent years. Both Elliott Advisors and Nelson Peltz’s Trian have taken significant stakes in UK-listed companies as varied as Unilever, Rentokil and Scottish Mortgage Investment Trust. They’ve often demanded a shake-up in strategy to help realise shareholder value.
The UK government has belatedly woken up to this issue, with chancellor Jeremy Hunt announcing plans in the Spring Budget to introduce an additional £5,000 ISA allowance to invest in UK-listed shares. With the Schroders UK Financial Adviser Pulse Survey 2024 showing that 80% of advisers would recommend a British ISA if it were introduced, the take-up could be quite material and surprise on the upside.
Heading back to a less topsy-turvy world?
Similarly, the Capital Markets Industry Taskforce (CMIT) has for months been working on a report designed to boost London as a listings hub. CMIT will no doubt take heart from the recent very successful initial public offering, or IPO, of Raspberry Pi, a profitable and fast-growing computing technologies company.
Meanwhile, a new government might just have some influence on when some on the conditions for UK equities improve, such as the very low levels of pension fund domestic equity allocations, which stand out versus other jurisdictions (see What might the UK election mean for the economy and markets?).
UK equity exposure within defined benefit pension funds can barely go any lower. So, in any event perhaps we are at an inflexion point and already heading back to a less topsy-turvy world for UK equity markets.
The sectors, securities, regions and countries shown are for illustrative purposes only and are not to be considered a recommendation to buy or sell.
For a description of bolded terms, see below
Capital markets/start-up companies Capital markets describe the system which channels savings, or capital, from lenders to borrowers, including start-up companies, which often require significant investment/capital to accelerate their growth.
Earnings per share, EPS The portion of a company’s total profits allocated to each share. EPS can be aggregated at the market level to help assess performance, as the higher the figure the more profits are available to distribute to investors in the equity market.
Index tracker/exchange-traded fund, ETF Investment vehicles that can be brought like an individual share (ETF) or fund (index tracker) and structured to track the performance of an equity market.
Initial public offering, IPO The process by which a private company sells shares for the first time and joins a public equity market.
Mid-sized companies Used to describe the relatively smaller public equity market companies at the earlier stage of their development, and which perhaps offer better growth prospects than the more mature incumbent large-sized companies.
Prospective PE multipe The prospective price-to-earnings multiple, or PE, is an equity market’s value, or price, divided by the prospective aggregate earnings of all its companies for the next 12 months. A lower number may represent better value.
* Bloomberg, FTSE Mid-250 Index excluding investment trusts – 26 June 2024
**The Passive-Ownership Share is Double What You Think, Alex Chinco and Marco Sammon – 19 May 2023
Important information
This communication is marketing material. The views and opinions contained herein are those of the named author(s) on this page, and may not necessarily represent views expressed or reflected in other Schroders communications, strategies or funds.
This document is intended to be for information purposes only and it is not intended as promotional material in any respect. The material is not intended as an offer or solicitation for the purchase or sale of any financial instrument. The material is not intended to provide, and should not be relied on for, accounting, legal or tax advice, or investment recommendations. Information herein is believed to be reliable but Schroder Investment Management Ltd (Schroders) does not warrant its completeness or accuracy.
The data has been sourced by Schroders and should be independently verified before further publication or use. No responsibility can be accepted for error of fact or opinion. This does not exclude or restrict any duty or liability that Schroders has to its customers under the Financial Services and Markets Act 2000 (as amended from time to time) or any other regulatory system. Reliance should not be placed on the views and information in the document when taking individual investment and/or strategic decisions.
Past Performance is not a guide to future performance. The value of investments and the income from them may go down as well as up and investors may not get back the amounts originally invested. Exchange rate changes may cause the value of any overseas investments to rise or fall.
Any sectors, securities, regions or countries shown above are for illustrative purposes only and are not to be considered a recommendation to buy or sell.
The forecasts included should not be relied upon, are not guaranteed and are provided only as at the date of issue. Our forecasts are based on our own assumptions which may change. Forecasts and assumptions may be affected by external economic or other factors.
Issued by Schroder Unit Trusts Limited, 1 London Wall Place, London EC2Y 5AU. Registered Number 4191730 England. Authorised and regulated by the Financial Conduct Authority.
Leave a Reply
You must be logged in to post a comment.