Feb
2026
‘Check Your Fees’ campaign as new Fat Cat Index shows most UK investors are overpaying hundreds of pounds each year
DIY Investor
9 February 2026
IG launches ‘Check Your Fees’ campaign as new Fat Cat Index shows most UK investors are overpaying hundreds of pounds each year
- IG’s ‘Fat Cat Index’ reveals significant fee disparities between platforms for comparable Stocks and Shares ISA services
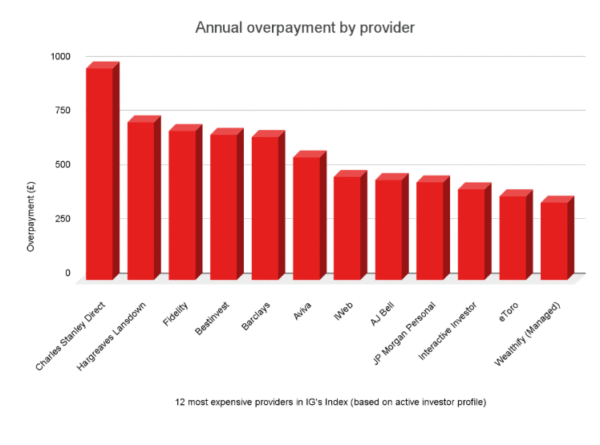
- Active Investors: Those using 12 priciest firms* overpay by an average of £515 a year
- Passive Investors: Typical overpayments reach £263 per year on high-cost platforms
- The Awareness Gap: 47% of UK investors have never calculated their total platform fees
Most UK investors are paying hundreds of pounds more than they need to in platform fees each year, according to the first ever ‘Fat Cat Index’ from IG.
IG’s analysis exposes a significant price gap between major UK investment platforms for Stocks and Shares ISAs, revealing that over half (52%) of investors are currently using the market’s 12 most expensive providers*. Platform costs vary significantly based on trading frequency. To account for this, the analysis categorises investors into three profiles: Passive (1 trade/month), Medium (3 trades/month), and Active (6 trades/month).
For an ‘active’ investor using a Stocks and Shares ISA with one of these platforms, the cumulative fees would be £515 more per year than if they used one of the market’s low-cost alternatives. For active investors using one of the four most expensive platforms, the average annual overpayment rises to £711. Over a 40-year investing lifetime, this would amount to almost £28,440 in avoidable costs, based on today’s fees and not accounting for lost compounding.
For less active investors, the costs are still significant. The average ‘passive’ investor using one of the 12 higher-cost platforms would still pay £263 more per year than if they used one of the market’s low-cost alternatives, while for those making three trades per month, the figure is £357.
Table showing what different types of Stocks and Shares ISA investors are overpaying
| Investor profile | Baseline annual cost (average of 5 cheapest providers) | 12 most expensive platforms – average overpayment | 4 most expensive platforms – average overpayment | Most expensive platform – overpayment |
| Active (6 trades p/m) | £54 | £515 annual overpayment | £711 annual overpayment | £922 annual overpayment |
| Medium (3 trades p/m) | £49 | £357 annual overpayment | £459 annual overpayment | £567 annual overpayment |
| Passive (1 trade p/m) | £44 | £263 annual overpayment | £344 annual overpayment | £404 annual overpayment |
Millions of customers are in the dark on fees
Alongside the index, IG surveyed UK retail investors with a Stocks & Shares ISA, with results revealing a significant knowledge gap on fees. Nearly half (47%) say they have never calculated their total fees, and the same proportion (47%) reports being confused by investment fee jargon, such as FX spreads and tiered charges. Despite this, more than half (55%) are confident they are paying the lowest possible fees – a reflection of the difficulty customers face in understanding what they’re actually paying.
Switching feels like a hassle
The research also found that nearly half (48%) of investors hesitate to switch providers because of the ‘life admin’ involved. This inertia is particularly pronounced among older investors, with 43% of over-55s having been with the same provider for more than 10 years, and a third (34%) of this age group saying they are unlikely to switch.
Michael Healy, Managing Director, UK & Ireland at IG Group, comments: “Most retail investors in the UK are being ripped off – paying hundreds of pounds a year in fees for a service they could access for far less by switching platforms. While investing was once expensive, it’s no longer the case, and there’s no reason for customers to miss out on compounded gains by paying through the roof in annual charges. That’s why we are calling on all UK investors to check their fees.
“We understand that investment fees can be complex. Between transaction charges, platform fees, subscriptions, and tiered pricing, it’s not always easy to work out exactly what you’re paying or to compare providers. But the likelihood is that if you’re paying multiple charges to invest, you’re probably paying too much. So if you can do just one thing this year as an investor, get on top of your fees – even small differences can make a huge impact over a lifetime.”
* Among those included in the index
**‘12 most expensive’ refers to the 12 highest-cost providers under the active investor assumptions. Because dealing/FX costs scale with activity, the composition/order of the highest-cost set can vary across passive/medium/active scenario.
About the data
What is the IG Fat Cat Index?
The IG Fat Cat Index quantifies the gap between a provider’s Total Annual Cost (TAC) and a low-cost benchmark in the market. For the press release calculations, the low cost benchmark is the average TAC of the five lowest-cost providers in the shortlist of 25 major investment providers (based on the behaviour of an ‘active investor’, assuming 6 trades per month and a 40% allocation to international shares). The platforms in the low cost benchmark are Trading 212, Freetrade, XTB, IG and Revolut, with the benchmark sitting at £54.27 as of January 2026.
How is Total Annual Cost calculated?
TAC is calculated using the following formulae.
For a platform that charges a % for a dealing charge:
TAC = (Annual Platform Fee % × Average HMRC portfolio size) + Flat annual platform fee (if any) + (total value traded per year [which = annual subscriptions plus portfolio turnover] × Dealing Fee % charge) + ( total value traded per year × Proportion executed in FX × FX Spread)
For a platform that charges a £ dealing fee, not a percentage:
TAC = (Annual Platform Fee % × Average HMRC portfolio size) + Flat annual platform fee (if any) + (72 × Dealing Fee £ charge) + ( total value traded per year × Proportion executed in FX × FX Spread)
Fee structures, spreads and commission rates were sourced from provider websites and were correct as of 1st February 2025.
How market share is evidenced
Because provider-level Stocks & Shares ISA account counts are not published in the public domain, the methodology uses Censuswide survey responses to indicate market share, ratified against the best available public indicators.
Consumer research
The supplementary research was conducted by Censuswide, among a sample of 1000 UK Investors (who have invested via a platform or app) who invest in a Stocks & Shares ISA. The data was collected in January 2026. Censuswide abides by and employs members of the Market Research Society and follows the MRS code of conduct and ESOMAR principles. Censuswide is also a member of the British Polling Council.
Investor type scenarios
For the press release, the passive / medium / active scenarios are designed to show how platform costs scale with trading frequency. The “active investor” assumptions (6 trades/month and 40% international allocation) are anchored to average UK IG investor behaviour (December 2025) and used as a consistent reference point across providers. Passive (1 trade/month) and medium (3 trades/month) are therefore illustrative comparators, included to provide balance and to demonstrate that the overpayment finding holds under different activity levels. Any monthly subscriber would make at least one transaction per month, making it a realistic ‘most passive’ scenario.
Provider costs are modelled under different activity scenarios because dealing/FX costs vary with trading activity; the set of 12 ‘highest-cost’ platforms can change by scenario. Each figure shown relates to the scenario stated.
Why is the low cost benchmark made up of five providers?
The analysis highlights the cost gap between major UK investment platforms and a low-cost market benchmark (based on the average fees of the five cheapest platforms). The aim is to shine a light on the stark difference in charges paid by investors accessing broadly comparable products.
For the press release calculations, the low-cost benchmark is the average TAC of the five lowest-cost providers in scope, which sits at £54.27 as of 1st February 2026. This provides a consistent low-cost end of market reference point rather than anchoring everything to a single provider. The providers are very close in cost and their offers differ slightly from platform to platform.
Leave a Reply
You must be logged in to post a comment.