Feb
2021
Beginning to See the Light: ‘…All men are created equal’ (1), only they aren’t.
DIY Investor
5 February 2021
 ‘Bill collectors they ring my phone,
And scare my wife when I’m not home,
Got a bum education, double-digit inflation,
Can’t take the train to the job, there’s a strike at the station,’
As I wrote in the background piece to this column, I believe that the wealth gap, income inequality, is the biggest non-environmental issue we must deal with, and one which explains electoral results such as Brexit, and Johnson’s sweeping electoral success in 2019. Looking further afield inequality was a key contributor to Trump winning the US presidency – writes Philip Gilbert
Oxfam estimates that:
- the world’s richest 1% have more than twice as much wealth as 6.9 billion people.
- Almost half of humanity is living on less than $5.50 a day.
- Billionaires have now more wealth than the 4.6 billion people who make up 60 percent of the planet’s population.
Income (2) inequality is how unevenly income is distributed throughout a population. The less equal the distribution, the higher income inequality is.
Income inequality is often accompanied by wealth inequality, which is the uneven distribution of wealth.
Measures, such as the Gini coefficient (3), can be used to analyse the level of income inequality in a population.
Another is the Palma ratio (4); the share of all income received by the 10% people with highest disposable income divided by the share of all income received by the 40% people with the lowest disposable income.
Reports show that the UK has a high level of income inequality compared to other developed countries (5).
- The majority of households in the UK have disposable incomes below the mean income (£34,200 as of 2018). This includes wages and cash benefits, and is after direct taxes like income tax and council tax, but not indirect taxes like VAT.
- The median income has been rising by 2.2% on average for the last five years. Most of this is accounted for by the rise in average income for the richest fifth, which has increased by 4.7%. The poorest fifth, on the other hand, have seen a fall in income by 1.6%.
In 2018, households in the bottom 20% of the population had on average an equivalised disposable income of £12,798, whilst the top 20% had £69,126. The top-20% had an income more than 12- times the amount earned by the bottom 20%.
The top 1% have incomes substantially higher than the rest of those in the top 10%. Since 1980, the share of income earned by the top 1% in the UK has generally been rising, peaking to 13% in 2015. This is almost double the corresponding figure for Belgium (7%) and still higher than Australia (9%), Sweden (8%) and Norway (8%), to name a few. For the whole world, the top 1% earn 20% of the total income.
The pie chart below shows how disposable income is shared amongst households. The poorest 20% of society has only 8% of the total income, whereas the top 20% has 40%.
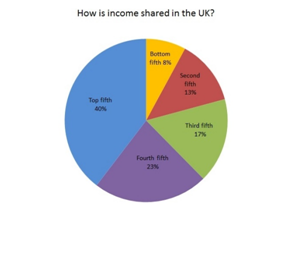
Disposable income share by quintile group for financial year ending 2018, ONS
The redistributive effect of taxes and benefits is felt most significantly in retired households, where disposable income inequality is lower than non-retired households. Retired households’ Gini for disposable income is 28.5%, whereas for non-retired households this figure is 32.8%. Most of the increase in retired households’ income since end-1970s has to do with the seven-fold rise in private pension income in this period.
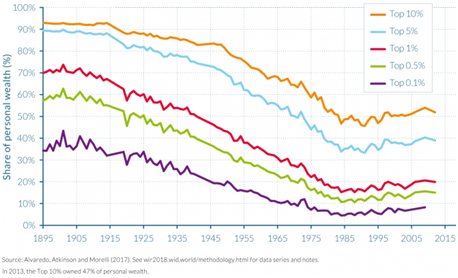
Wealth in Great Britain is even more unequally divided than income. In 2016, the ONS calculated that the richest 10% of households hold 44% of all wealth. The poorest 50%, by contrast, own just 9%. In the UK as a whole, the top 0.1% share of total wealth doubled between 1984 and 2013, reaching 9%.
The graph below shows how wealth distribution has changed since the last century:
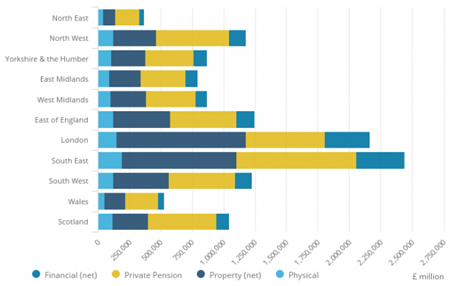
This wealth is spread unevenly across the country. The SE is the wealthiest of all regions with median household total wealth of £387,400, over twice the amount of wealth in households in the NW (£165,200)
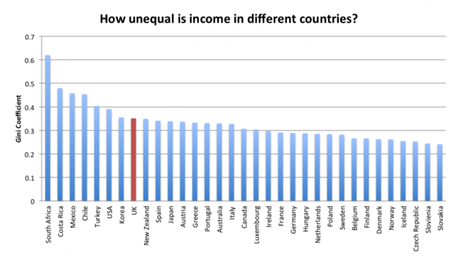
Compared to other developed countries the UK has a very unequal distribution of income, with a Gini coefficient of 0.35. According to 2013 data from 19 OECD member states in the Luxembourg Income Study data set, the UK is the fifth most unequal, and fourth most unequal in Europe.
Income inequality in the UK isn’t new, but it had fallen it has been consistently falling in the post-war years, until 1979, and the election of Margaret Thatcher as PM. When she was elected the Gini coefficient was 0.253, by 1992 it had risen to 0.340 in 1992, where it remained until the start of the GFC financial crisis when it started to fall back.
In the 42-years since Thatcher was first elected, we have had 31-years of Tory governments, who have spent much of their time in office deliberately impoverishing people by blocking higher pay, fairer chances, good social housing, and decent social security.
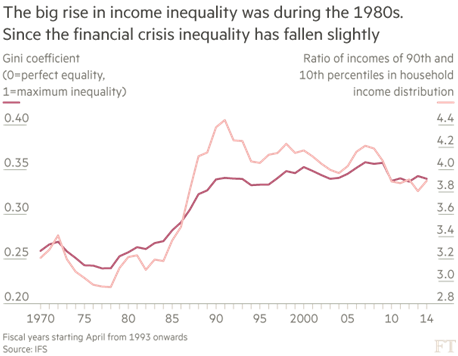
Another way to measure inequality is to look at the Palm Ratio (4), the ratio between different points in the income distribution. For example, by comparing the net household income of those 90% of the way along to the income of those 10% of the way along.
- In 1992, this so-called 90/10 ratio stood at 4.3; those at the 90th percentile had income 4.3 times larger than those at the tenth.
- By 2007 the ratio had barely moved and stood at 4.2. It then fell during the financial crisis and was 3.9 in 2014, the most recent year for which data are available.
In the post-war years household incomes grew steadily, with each generation enjoying a better standard of living than the one before.
- Average net household incomes grew by an average of 2.4% a year between 1961 and 2000.
- Between 2000-2008 (the GFC) income growth slowed to 1.9% a year on average.
- Since 2008, household incomes have grown on average by just 0.1 per cent a year. Mark Carney, governor of the Bank of England, recently described it as a ‘lost decade’; the first time since the 1860s that real wages have fallen over a 10-year period.
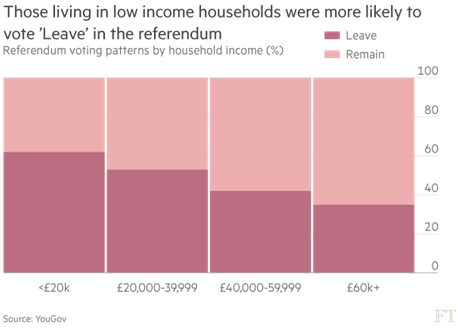
Whist there are likely many reasons why 52% of the electorate voted ‘Leave’ in the 2016 EU referendum, it can surely be no coincidence that C.62% of those with household income below £20,000 a year voted to ‘leave’, compared with 35% per cent of households with income more than £60,000 a year.
Post the GFC, central banks, including the Bank of England, have been propping up the real economy by bailing out banks, keeping interest rates low, and buying bonds via Quantitative Easing.
Since 2008, the Bank of England has created about £900bn of money through quantitative easing. Most of the population has seen no benefits from this, all it has achieved is an increase in the wealth gap
This money has led to a huge transfer of wealth from the real economy into financial assets, e.g., equities. Voters have been seduced into believing that rising financial asset prices equate to economic success.
For example, Trump was able to equate the success of his presidency with a rising stock market and bullied the Federal Reserve Bank into lowering interest rates to increase equity prices when his popularity wavered.
The policies adopted by central banks post the GFC have been extended and exacerbated by the C-19 pandemic. In America it is estimated that of the $5 trillion of government economic support, only $2 trillion has gone into the real economy. Coincidentally, it is estimated that the richest 1% of Americans have seen their worth rise by $3 trillion in financial assets because of C-19.
When researching this piece, I found the following research which highlights just how far asset prices have become distorted: ‘Total stock market capitalization vs GDP on inauguration day of a new president: Ford: 40% Carter: 47% Reagan: 43% Bush I: 53% Clinton: 64% Bush II: 117% Obama: 60% Trump: 125% Biden: 190%’ (6).
The pandemic is the latest event that highlights the consequences on this inequality, as C-19 spreads more easily among the people least able to protect themselves.
ONS data show death rates among men in ‘elementary’ jobs are considerably higher than among professionals. The lowest paid have little control over their working lives and conditions, and many can’t afford to self-isolate. They estimate that roughly four out of five with symptoms are not coming forward to be tested. While individuals get instant fines, not one company has yet been charged with a C-19 related breach.
The lowest-paid (7) are more than twice as likely to have lost their jobs in the coronavirus pandemic than higher-paid employees, according to a study by The Institute for Employment Studies. One in 20 low-paid workers had fallen out of a job in each quarter since the pandemic struck – equivalent to 250,000 workers across Britain – compared with one in 50 of those on higher wages.
While employment is plummeting for the low-paid, driven by job cuts in sectors hardest hit by lockdowns such as food services and hospitality, the report found job opportunities were increasing for higher-paid staff.
The report warns that the pandemic is dramatically exacerbate inequalities in the world of work, finding that many were slipping through cracks in the government’s emergency support schemes such as furlough. It said in many cases low-paid workers reported being denied furlough, having their hours cut, being expected to work without adequate protection, and seeing their living costs increase while their incomes fell.
The chancellor’s plan to cut the temporary £20 additional payment of universal credit highlights the great social divide. To many, such as the professional and managerial classes, it’s irrelevant, but £20 extra to spend on groceries doesn’t keep many families away from the food bank.
Claims for universal credit in the most deprived 10% of areas increased by 8.5% from February to October last year. However, the increase was far lower in the most affluent 10%, where the average increase was 4.8%.
Whilst this cut to universal credit would save the exchequer £6bn to his exchequer, the number of children estimated to fall into poverty would increase to 34% by 2024. Lest we forget, the current figure for child poverty is, a disgracefully high, 30%.
With unemployment expected to rise, the Resolution Foundation report that our basic benefit rate is at its lowest in real terms since 1990-91. Torsten Bell of the Resolution Foundation this week highlighted the fact that, due to benefits parsimony, the bottom 20% of people have seen their incomes fall for the past 15-years, whilst everyone else’s rose.
A recent household financial confidence tracker, for ‘Comparethemarket’, found 52% of those surveyed were spending savings and 53% were worried they would run out of money.
More than 25% of households with families surveyed said they had struggled to pay bills in the past week, while 16% of those with no children at home said the same.
The same proportions said they felt less financially secure now than in previous lockdowns, while 10% of families said if lockdown restrictions continued beyond April they were worried they would not be able to pay their mortgage or rent.
Whilst the Chancellor has been supporting the economy during the pandemic, much of this has gone to business with extended furlough payments, VAT relief, rates relief, interest-free loans, and massive quantitative easing.
He has been unbelievably casual with our money as the government has approved multimillion-pound contracts to ministers’ friends and allies.
Whilst there will always be the super-rich, income inequality in the UK is higher than it should be. What is strange is that there should be a correlation between inequality and unemployment, however, statistically that isn’t the case.
The so-called ‘golden age of capitalism’ ended in the 1970s, between 1947 and 1973 UK unemployment averaged 2.1 per cent. From 1974 unemployment started to rise and remained relatively high for the rest of the century, across most advanced economies. Several economists, of which Paul Samuelson (9) was the most prominent, argued that this may be due to innovation, often referred to as ‘structural unemployment’(10).
This is reflected in UK data which shows the unemployment rate in Britain averaged 10.1% between 1974 – 1999.
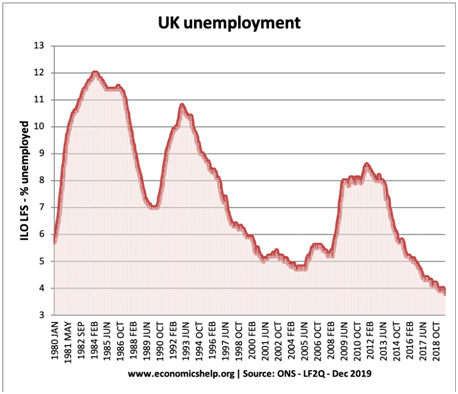
This is where unemployment and income inequality diverge; with the obvious exception of the GFC and the C-19 pandemic UK unemployment dropped considerably between 2000-2019. What I want to explore now are the reasons for this non-correlation.
Flexible Labour Markets: Evidence suggests that it is easier to cut hours and keep people employed on shorter working hour contracts, as illustrated by a rise in under-employment.
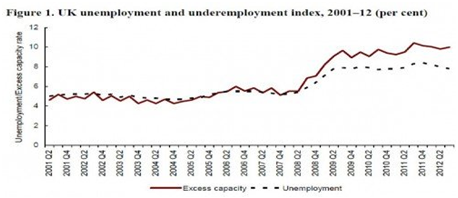
More people are working fewer hours than they would like. Flexible labour markets also make it easier to hire and fire workers.
Flexible Pay: In the 10-years where real wages have remained stagnant. This has encouraged firms to retain low-paid workers rather than making cuts to the number of workers. If unions were more powerful, and workers could bargain for higher wages, it is likely that unemployment would be higher.
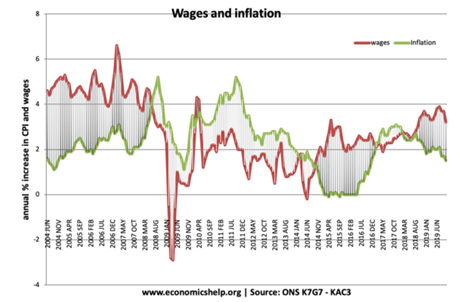
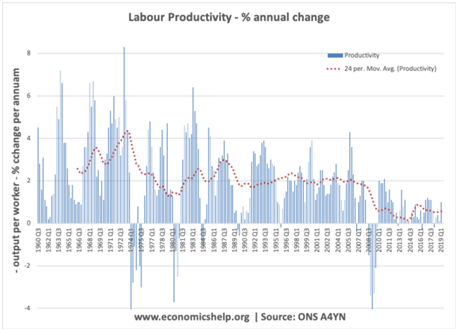
Falling Productivity: Usually, labour productivity increases by around 2.5% a year, but since 2008, labour productivity has been stagnant or growing very slowly. With low productivity growth firms need relatively more workers. If productivity growth was high, firms could produce the same output with fewer workers.
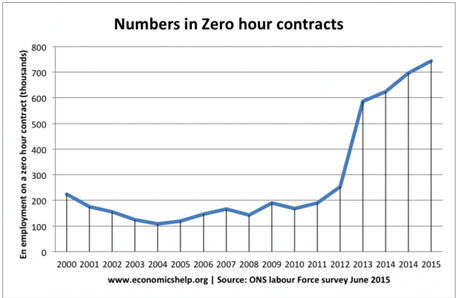
Growth of zero-hour contracts: Zero-hour contracts means workers have no guarantee of how many hours they will get paid for. It is a factor in explaining why there is more under-employment.
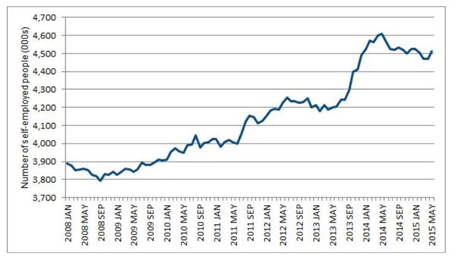
In 2013, there are 367,000 more self-employed people than in 2008. More than 200,000, or 60% of these, became self-employed between 2011 and 2012. This suggests, that in response to deteriorating labour market conditions, more people are seeking to set up as self-employed.
More difficult to claim benefits: Post-GFC the Tory’s austerity policies tightened up the criteria for claiming benefits. If the unemployed wish to be counted as unemployed, they must prove they are looking for work and willing to accept a job if it is offered. With real benefits falling behind wages, there is a strong incentive to take employment – even if it is fewer hours than workers would like, or it doesn’t reflect their skills.
In conclusion, the ‘good’ unemployment figures are ‘fool’s gold’, they come at the cost of falling/stagnant real wages and poor labour productivity. Low productivity growth has led to poor real GDP per capita growth.
As we saw with the 2016 EU referendum and the more recent 2019 general election, voters are beginning to express their dissatisfaction with this inequality. It remains to be seen whether leaving the EU and a more populist style Tory government can achieve the ‘levelling-up’ necessary.
Several regions that voted ‘Leave’ were the ones that benefitted most from EU grants and subsidies. In addition, believing that a Tory government cares about this inequality more than pandering to their rich donors stretches the bounds of credibility.
As the old saying goes, ‘if you kick a dog long enough, that dog is going to bite you or die’.
‘Through the mansions of fear, through the mansions of pain,
I see my daddy walking through them factory gates in the rain,
Factory takes his hearing, factory gives him life,
The working, the working, just the working life.’
Notes:
- The second paragraph of the United States Declaration of Independence starts as follows: ‘We hold these truths to be self-evident, that all men are created equal……
- Income is defined as household disposable income in a particular year. It consists of earnings, self-employment and capital income and public cash transfers; income taxes and social security contributions paid by households are deducted. The income of the household is attributed to each of its members, with an adjustment to reflect differences in needs for households of different sizes. Income inequality among individuals is measured here by five indicators.
- The Gini coefficient is based on the comparison of cumulative proportions of the population against cumulative proportions of income they receive, and it ranges between 0 in the case of perfect equality and 1 in the case of perfect inequality.
- S80/S20 is the ratio of the average income of the 20% richest to the 20% poorest;
P90/P10 is the ratio of the upper bound value of the ninth decile (i.e. the 10% of people with highest income) to that of the first decile;
P90/P50 of the upper bound value of the ninth decile to the median income;
and P50/P10 of median income to the upper bound value of the first decile.
- https://www.equalitytrust.org.uk/scale-economic-inequality-uk
- https://stockhouse.com/companies/bullboard/cnrif/condor-resources-inc?postid=32422016
- The study defined low pay as less than £9.50 an hour, and £10.85 an hour in London.
- ‘Unemployment and the UK Labour Market Before, During and After the Golden Age’, by Timothy J. Hatton, University of Essex, and George R. Boyer Cornell University.
- Samuelson, Paul (1989). ‘Ricardo Was Right!’. The Scandinavian Journal of Economics.
- Structural unemployment came be defined as the result of industrial reorganization, typically due to technological change, rather than changes in supply or demand.
An epic from Philip this week as he treats us to another in-depth investigation of the recurring themes that have underpinned his column; this time its income and wealth inequality.
His typically self-deprecating preamble said: ‘sorry if this week’s piece reads more like someone’s economics homework. Unfortunately, with a subject such as this you need data to prove the argument’.
Well, there’s no doubt that Statto would find plenty to admire in the opening skirmishes of Philip’s piece; maybe we have been so inured to it that it almost feels as though it could be appropriate to conclude that inequality is too high, it’s been getting higher, 31 years of Tory rule since Mrs Thatcher came to power 42 years ago, austerity – rich get rich, bears trudge to the woods with newspaper shocker.
However, what makes the piece so powerful is what that means in real life, and how the figures can sometimes mask what is really going on.
Few will be surprised that the GFC had such a profound and lasting effect on incomes and wealth, and there is a certain inevitability that those already disadvantaged will lose further ground; not to mention the fact that they are more likely to suffer physical and economic harm – the fact that an estimated 4 out of 5 with symptoms didn’t get tested is shocking, but explains in no small part the UK’s place at the top of the Reaper’s Top Twenty.
However, what has accompanied it is an increase in employment uncertainty and an erosion of quality; when benefits fall in real terms McJobs with too few hours and no protection become the only option.
Before you drop a few coins in Jeff Bezos’ leaving card, reflect that his net wealth increased by $70bn during the pandemic to $185bn; according to the Guardian, the world’s billionaires ‘did extremely well’ during the coronavirus pandemic, growing their already-huge fortunes to a record high of $10.2tn (£7.8tn).
And, as Philip points out, the money that has been pumped into the economy via quantitative easing has done done nothing in terms of trickling down; rather it created an asset bubble from which the wealthy were able to further capitalise by speculating on the return of markets following the first lockdown.
In a future article Philip intends to speculate on the potential political ramifications; he’s never shied away from saying that he believed austerity and inequality played a major role in the 2016 vote. It will be interesting to see if he believes the Tories populist pledge to ‘level up’ has any legs.
And in case you wonder at the size of the challenge facing Sir Kier, a recent poll concluded that Alexander Boris dePfeffel Johnson, Eton alumni was the more ‘relatable’ of the two main party leaders.
So how does Labour plan to strike back – well, its obvious really, they intend to dress smartly and flourish a union flag at every opportunity.
For fun only, we have a couple of corkers to identify – bragging rights for Grandmaster Flash and the Furious Five and ‘The Message and Bruce Springsteen with ‘Factory’. Enjoy.
 Philip Gilbert is a city-based corporate financier, and former investment banker.
Philip is a great believer in meritocracy, and in the belief that if you want something enough you can make it happen. These beliefs were formed in his formative years, of the late 1970s and 80s
Click on the link to see all Brexit Bulletins:

Leave a Reply
You must be logged in to post a comment.