Feb
2020
Investment Trusts: Choose your own adventure
DIY Investor
19 February 2020

Napoleon insisted he would rather have his generals be lucky than good.
Increasingly, especially when investing in the US stock market, many investors opt for a passive fund, presumably viewing markets through the same prism that managers are really only ever lucky, as opposed to good.
Yet many still choose active funds for a variety of reasons: a preferred investment style (or factor bias), or an alignment between the investor and the manager on the macroeconomic outlook are chief among them.
For these investors, forming a view on when different styles are likely to perform, and on which macroeconomic environment we are likely to see is crucial.
‘forming a view on when different styles are likely to perform, and on which macroeconomic environment we are likely to see is crucial’
In this article we look at how different factor indices in North America have performed in different economic and market scenarios.
We then examine which US-focussed trusts have offered the closest correlation to these factor indices in the recent past.
Understanding the impact that broader economic trends have had on the performance of factors – and, by extension, on trusts that seem to operate in close alignment with those factors – can help us to understand and contextualise historic performance.
It may also give us some insights on how to position for any anticipated future environment, although there can be no guarantee that historic patterns will repeat.
Background
US stock markets have, despite intermittent wobbles, been a highly rewarding place for investors in recent years.
Yet they have proven extremely challenging for stock pickers, helping drive a trend where investors are increasingly using passive vehicles which track the whole stock market.
So strong has been this trend that some estimates suggest at least 50% of all assets in US stock-based funds are now held in passives.
‘at least 50% of all assets in US stock-based funds are now held in passives’
Driving this trend (or perhaps as a result), US stock indices have seen outstanding returns in recent years from their very largest constituents.
In the five years to 1 February 2020, the equal weighted average return from Amazon, Apple, Microsoft, Facebook and Alphabet shares was c. 271%, against a return from the Russell 1000 index of c. 77%.
Even the relative laggards of Alphabet and Facebook returned more than twice as much as the wider market, with gains accruing to previous ‘winners’ in a winner-takes-all environment (we covered some of these issues in a previous piece here).
More generally, the recent investment epoch has been set against a backdrop of policy from global central banks and governments that has been consistently supportive of financial markets.
This environment has proven strongly favourable to quality and growth factor investing, which is systematically more likely to incorporate the above ‘winners’, whereas, for example, a value factor approach would likely preclude investment in Amazon.
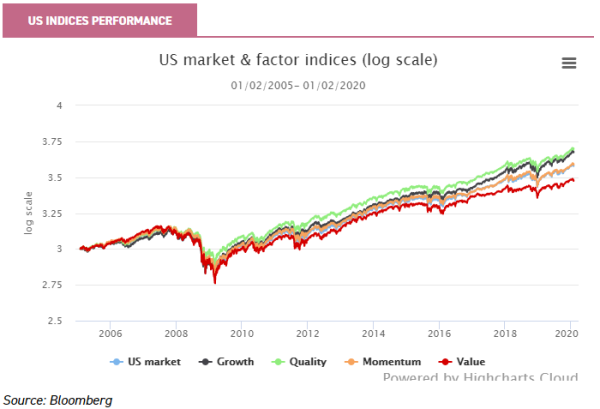
The chart below shows the returns generated by factor indices indexed and produced on a log scale (to remove exponential bias for the most recent data; as such the the figures on the y-axis should be disregarded, as they are for indexing purposes and not a representation of the percentage return generated).
We can see that over the past 15 years there has generally been a gradual, sustained and accretive outperformance of quality factors; we can also see the inverse has been true of value factors, especially since c. 2007-09.
That this has coincided with a sustained period of extraordinary monetary policy is likely no coincidence. We can also see that growth factors have consistently outperformed, and that this has trend accelerated somewhat in recent years.
Going forward, different factors are likely to respond variously to different macro conditions. For investors looking to allocate to active investment strategies, we can use a range of factors to suggest possible performance patterns in a range of different scenarios.
The scenarios
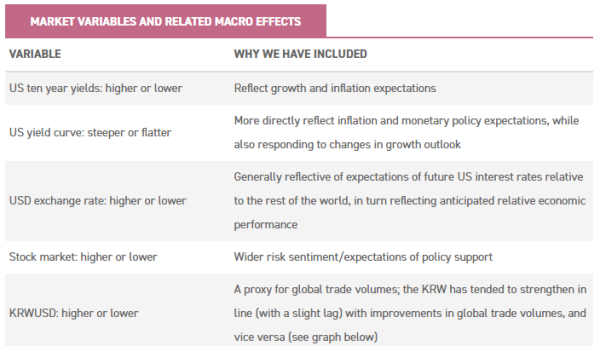
In the table below, we identify a range of different variables which could reflect the broader global macro environment.

Factor performance in different environments
In order to better understand drivers behind each factor (growth, momentum, quality and value), we measured the relative performance of each factor index against a benchmark of the whole market.
We also looked at how relative performance was affected by different economic and market conditions.
For example, we analysed how each factor index performed in an environment where bond yields rose historically, compared with periods when they fell.
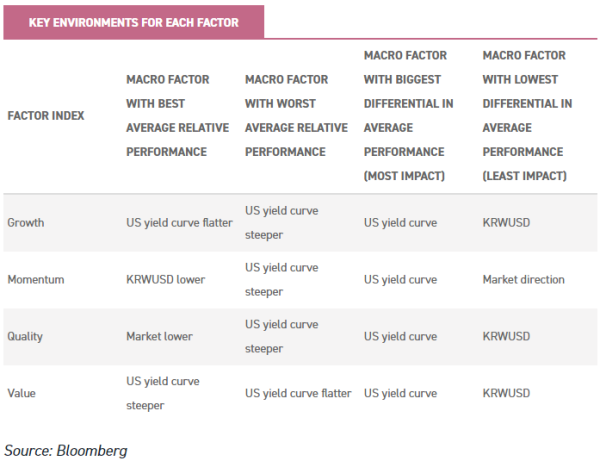
The table below shows the economic variables which on average have proven most and least beneficial for each factor.
At the same time, we looked at which trusts with at least 50% exposure to US equities aligned most closely with the four different style indices we have used and considered whether these patterns are likely to continue.
Growth
Recent years have clearly been highly favourable to growth strategies, with the growth factor index outperforming consistently across most market conditions.
However, what is notable is that relative returns have been stronger in periods where bond yields are declining, and bond yield curves flattening.
These conditions can arise as investors’ outlook for economic growth diminishes, or their inflation expectations fall, reducing their long-term outlook for interest rates.
As has been noted in the past, this pattern can be a function of investors bidding up for growth when it becomes scarcer, and can reflect anticipation of a lower cost of capital in future.
Market directionality has also been relevant to this style, with growth factors doing better in environments where the market was rising, compared to periods when it was falling.
With significant debt overhangs, stagnant productivity, and ageing demographics, there seems no particular reason why we should see a sea-change in this environment in the near future.
The US Federal Reserve has, in recent months, hinted that it will adopt a more flexible approach to inflation targeting, looking to hit an average inflation target (and thus allowing periodic overshoots).
This change in approach offers a further hint that we may be in for a perpetuation of the low-rate environment, which might continue to benefit growth strategies.
Looking at the R2 of various North American and technology focused trusts over the past year, Polar Capital Technology (PCT) is the trust that has been most closely aligned with the growth investment style.
‘growth factors doing better in environments where the market was rising, compared to periods when it was falling’
This is unsurprising, given technology companies are typically the beneficiaries of exactly the conditions set out above. PCT tends to tilt towards large-cap technology companies, and in an environment where passive flows continue to dominate, there will likely be further increases in its R2 to index strategies.
However, looking at the average rolling 3-year R2 back to 2012 (i.e. ten years of data), we see that JPMorgan American (JAM) has had a closer correlation to the growth index.
In part this is likely because the trust’s use of gearing has helped ensure upside capture at a time of growth outperformance, but this result is still somewhat surprising given JAM has historically been relatively stylistically balanced in its approach.
However, large-cap weightings (including significant positions in Microsoft, Apple, Amazon, and Alphabet) likely increased JAM’s correlation to the growth index.
We anticipate that going forward the trust is likely to be less correlated than historically given recent changes to its management arrangements.
Jonathan Simon and Timothy Parton assumed the reins in mid-2019, and the managers both have a mandate to run highly concentrated portfolios alongside each other, comprising between 10 and 20 stocks each.
However what sets them and the new structure apart is that one is a specialist value investor, while the other is a specialist growth investor.
Thus the split between growth and value at JAM is expected to remain fairly evenly balanced over time; the managers hope that this will mean the trust will prove robust against any future significant style rotations between growth and value.
Momentum
Momentum strategies had benefitted from the ‘great moderation’, but market rotations in recent years – as market ‘certainties’ about a path of permanent Federal Reserve easing were challenged – have created a more difficult environment for them.
This was best seen in the 2015-2016 period, when tighter monetary conditions and uncertainty over the Chinese economy, followed by a swift reversal in sentiment, saw notable sector rotations over relatively short periods of time.
‘momentum strategies struggled more in an environment where yield curves were steepening and global trade increasing’
Looking at the data, US momentum strategies have benefitted most greatly from flatter US yield curves, and from declining global trade (measured by the Korean Won/USD (KRWUSD) exchange rate).
This suggests that the anticipation of monetary easing and support has often driven a flight to existing leaders, with flows allocating to the most liquid assets.
Similarly, momentum strategies struggled more in an environment where yield curves were steepening and global trade increasing; we would speculate this is because both indicators suggest a broad macro upswing which might lift all boats.
Once again, JPMorgan American has a greater correlation to the short-term and longer-term momentum measures, while PCT’s correlation is similarly high on a relative basis; this seems likely for much the same reasons as noted under Growth above.
Quality
As growth becomes scarcer in the short-term, investors have frequently looked for greater certainty of growth rather than the greatest rate of growth.
Accordingly, it is unsurprising that quality factors have tended to do better in environments where yields were flatter and lower (which would generally suggest a less positive economic outlook from the market), or that they have tended to outperform when the market declines.
What is perhaps more surprising is that upticks in global trade, as seen through a rising KRWUSD, have tended to see quality factors outperform.
‘aim for high quality businesses, seeking to balance this with dividend growth and valuations’
This can perhaps be read as a ‘winner-takes-all’ trade, with the leading global companies perceived as being best placed to meet rising local demand.
Quality factors underperforming slightly as yield curves steepen is perhaps unsurprising, as lower quality, more cyclical companies which display greater operational exposure to the wider economy are likely to benefit from rising inflation expectations.
As well as JAM, Blackrock North American Income (BRNA) has also been correlated closely to quality factors in recent years.
The aim of generating income will naturally lead the team into companies with solid, sustainable business models, and cash flows that can pay out reliable distributions.
These could be described as intrinsically ‘quality’ characteristics.
The BRNA team explicitly aim for high quality businesses, seeking to balance this with dividend growth and valuations. The trust’s focus on metrics such as capital allocation quality, balance sheet strength and operational quality means BRNA is likely to continue to be reasonably correlated to quality factor indices going forward.
Value
Recent years have been difficult for value investors across the globe, but these difficulties have been particularly acute in the US.
Even their existing valuation discounts have not prevented value companies from de-rating in line with the market during drawdowns, though underperformance has at least been less noticeable on average in these periods.
However, the marginally stronger performance of value stocks in times when the yield curve has steepened is perhaps in line with what can be expected going forward, given financials (which benefit from yield curve steepening) and materials (which benefit from a perceived inflationary uptick) are typically significantly represented in value portfolios.
That both of these would likely be vulnerable to a slowing economic environment (with concurrent lowering of interest rate expectations) means the falling and flatter yield environment has proven challenging for the value style factor.
‘a steeper and higher rate environment, with higher inflation, might be necessary if we are to see a sustained value recovery’
Going forward, a steeper and higher rate environment, with higher inflation, might be necessary if we are to see a sustained value recovery.
There have been some incipient signs of this outcome, with tight labour markets leading to wage pressures in the US in particular, and commodity prices continuing to creep higher in general.
With a substantial global supply shutdown in the wake of the coronavirus (alongside disruption to supply chains), if demand remains robust this could trigger demand-led inflation.
It is, however, too early to quantify whether this would outweigh the reduction in demand from producers.
BRNA shows some correlation to value factors, unsurprisingly as it is benchmarked against the Russell 1000 Value index, and that the team employ a variety of valuation screens in their investment process.
Seeking to provide an income from the US market – which typically prefers to return capital through share buybacks rather than paying dividends – will also provide inherent leanings to a value investment style as the managers seek higher yielding stocks.
Also showing correlation to a value factor index is the Gabelli Value Plus+ (GVP) trust. The managers of this trust seek to invest across the market cap spectrum to generate a highly differentiated portfolio to the wider US market.
Valuation is primarily undertaken on an individual stock level, trying to determine if companies are trading at significant discounts to the strategic value they would offer a private investor.
Whilst the managers tend to avoid making bets on macro or market environments, the proportion of the trust dedicated to merger arbitrage (c. 10%) will likely benefit in a rising rate environment.
Trusts and closest style alignment
The table below shows the factor index to which each trust in the North American and North American Smaller Companies AIC sectors has been most closely aligned. Also shown are those global equity trusts which have over 50% of their assets invested in the US (as of 31 January 2020).
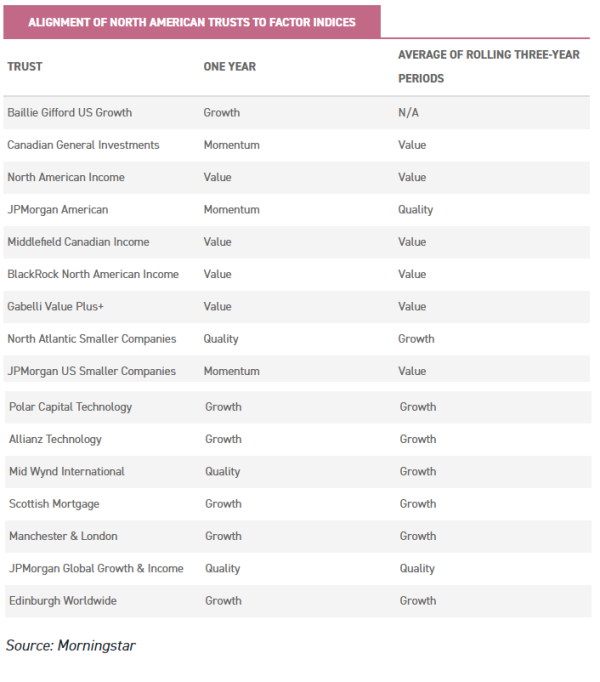
It is clear from this table that a range of options remains available to investors. It should be cautioned that, just because a trust has a higher R2 to a given style factor, that does not necessarily mean they have been closely aligned (just that they have been more closely aligned than the other factor indices); or, if they have, that the close alignment will necessarily continue.
Conclusions
We can see from the above analysis what has happened, and what the effects have been.
Yet none of this tells us anything about the future environment, only what has happened in the most recent investment epoch.
We may be about to move into a new environment, or conditions may remain essentially immutable. The predominance of passive flows in the US market makes price discovery in the market of decreasing importance, to the benefit of momentum factors but no others.
Yet, as John Bogle (the founder of Vanguard) once noted, increasing indexation should give active investors an opportunity to exploit pricing inefficiencies.
Are we nearer the tipping point where this occurs, and, if so, which investment factors might be best placed to benefit?
Investors looking to access the US market through investment trusts have plenty of options to help align their equity strategy with their macro outlook.
The future is, of course, inherently uncertain, but investors with strong feelings on the likely direction of various macro indicators can perhaps draw some conclusions.
Those who expect the outperformance of the US to the rest of the developed world to continue and accelerate may wish to focus on trusts with quality and growth tilts, especially if they do not yet see the global economy reaching ‘escape velocity’.
If they believe that demographic factors and debt overhangs remain a disinflationary overhang too powerful for monetary policy to overcome permanently, then quality and growth factors may continue to do well.
Similarly, investors who expect a more steady and consistent supply of monetary support to the US economy may reasonably prefer to hold strategies that are more exposed to momentum factors.
Value investing has a long pedigree, and the recent difficulties of this strategy are essentially unprecedented in scale and extent.
Trends do not die of old age, however, and a change in environment may be necessary before a sustained value recovery is in the offing.
Could this happen? Higher inflation, with attendant higher bond yields and steeper yield curves, could change the operating environment for value strategies.
Similarly, a breakout in global growth to a more rapid pace would likely benefit many value strategies, not just those in the US.
And, lastly, the above factors and passive index strategies face perhaps one more risk we cannot quantify: politics.
With the US presidential election later in the year, candidates on both sides have made noises about increased concentration in US industries, and have even suggested forcible break-ups of some of the largest companies.
This may be all noise, but if it were to transpire it could trigger a significant improvement in value performance.

For more information visit:

This is not substantive investment research or a research recommendation, as it does not constitute substantive research or analysis. This material should be considered as general market commentary.
Past performance is not a reliable indicator of future results. The value of investments can fall as well as rise and you may get back less than you invested when you decide to sell your investments. It is strongly recommended that Independent financial advice should be taken before entering into any financial transaction.
The information provided on this website is not intended for distribution to, or use by, any person or entity in any jurisdiction or country where such distribution or use would be contrary to law or regulation or which would subject Kepler Partners LLP to any registration requirement within such jurisdiction or country. In particular, this website is exclusively for non-US Persons. Persons who access this information are required to inform themselves and to comply with any such restrictions.
The information contained in this website is not intended to constitute, and should not be construed as, investment advice. No representation or warranty, express or implied, is given by any person as to the accuracy or completeness of the information and no responsibility or liability is accepted for the accuracy or sufficiency of any of the information, for any errors, omissions or misstatements, negligent or otherwise. Any views and opinions, whilst given in good faith, are subject to change without notice.
This is not an official confirmation of terms and is not a recommendation, offer or solicitation to buy or sell or take any action in relation to any investment mentioned herein. Any prices or quotations contained herein are indicative only.
Kepler Partners LLP (including its partners, employees and representatives) or a connected person may have positions in or options on the securities detailed in this report, and may buy, sell or offer to purchase or sell such securities from time to time, but will at all times be subject to restrictions imposed by the firm’s internal rules. A copy of the firm’s Conflict of Interest policy is available on request.
PLEASE SEE ALSO OUR TERMS AND CONDITIONS
Kepler Partners LLP is authorised and regulated by the Financial Conduct Authority (FRN 480590), registered in England and Wales at 9/10 Savile Row, London W1S 3PF with registered number OC334771.
Leave a Reply
You must be logged in to post a comment.