Apr
2023
Asset managers had a poor 2022
DIY Investor
12 April 2023
Asset managers had a poor 2022: the S&P Composite 1500 Asset Management Index was down 22% and, according to the Investment Company Institute (ICI), worldwide mutual funds fell by 20%, from $76tr to $60tr. When bond and equity markets fall, the results are unlikely to be pretty: with revenues trending down and multiples contracting, there is a double whammy to contend with – by Jason Streets
So how do valuations shape up now, after a bullish start to the new year? The chart below is my favourite chart of asset manager valuations – it has so much information in it. The x-axis is the EBITDA as a percentage of assets under management (AuM), and the y-axis is the market cap as a percentage of AuM. Thus, a line drawn from the intercept out is the market cap/EBITDA ratio.
There are 20 companies represented on the chart, which we can group into three categories: asset managers, platforms and wealth managers. But even as one group, the line of best fit has a correlation coefficient of 0.92, and its gradient is a market cap/EBITDA of 10.8x.
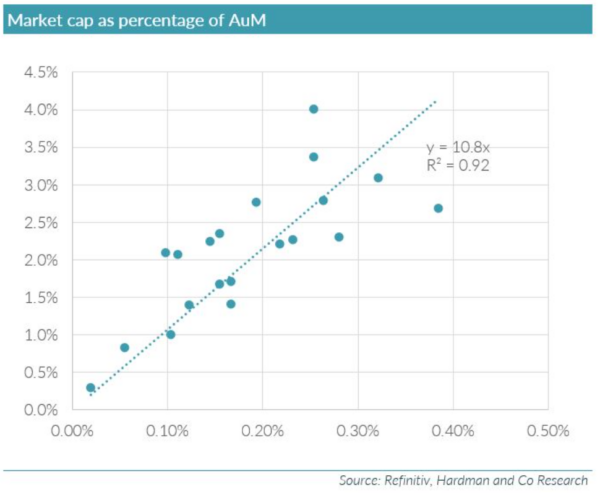
The two biggest outliers are Man Group and Ashmore. Man Group is below the line on the far right. In simplistic terms, it is “cheap”: it has the highest EBITDA/AuM margin, at 0.38%, and a middling valuation, at 2.7% of AuM. This is almost certainly explained by its very high proportion of performance fees. At the last reporting date, for the half year to June 2022, it made $469m of management fees and $404m of performance fees.
Ashmore, on the other hand (above and to the left of the line), is “expensive”, with a high-ish EBITDA/AuM margin, at 0.25%, but the highest valuation by assets, at 4.0%. This is due to a combination of two things: a very high proportion of cash and investments in its market cap (110p at its June 2022 year-end, out of a 270p share price) and its very strong run in the past three months (up 50% from its mid-October low). If the consensus estimates do not follow the upward movement of the share price, Ashmore could begin to look vulnerable.
To provide a bit more explanation, we pose the question: “Why do we use market cap, instead of enterprise value (EV), which would be more usual for an EBITDA multiple”? All the companies have net cash, and so their EVs are lower than their market caps. They all need regulatory capital, although this could be partly in the form of debt instruments.
In general, asset managers like to carry surplus cash, as the business itself is so high-beta. The good times are great, but the bad times can be very difficult, as New Star found, to its cost, in the Global Financial Crisis (GFC). And if you take the classic examples of Ashmore and Schroders, both of which carry very substantial surplus cash balances, they have always held these massive surpluses. Arguably, this is part of their business model and so, when looking at valuation, it would be a mistake to strip them out.
Ashmore is, perhaps, a special case. The proportion of cash and investments is very high for a near £2bn market cap company, and it is exposed to a slightly esoteric field: emerging market bonds. Its scale and unusual exposure make it an attractive proxy for equity investors taking a view on emerging markets. It is frequently a highly shorted stock and, presumably but not so obviously, heavily overweighted, depending on expectations for emerging markets.
Enterprise value (EV)
If we plot EV and EBITDA, we end up with a very similar chart to the previous one, but with the points spread a bit further out and the correlation fractionally lower (0.87) – although still high and still showing very much the same pattern.
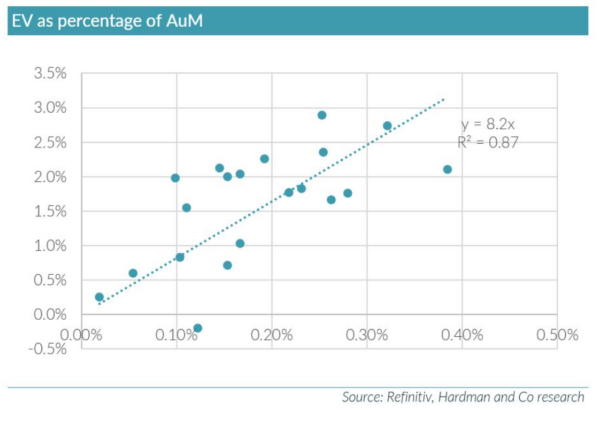
As a point of interest, on this chart, Ashmore is bang on the regression line (2.4%, 0.26%) and pretty much in the centre of the plot.
Adjustments
Some further adjustments would be desirable, but they require some more subjective input. In particular, I would like to adjust for performance fees, but this is beyond the scope of this short report. When I did this exercise previously (in 2007), the market was rating performance fees on only three times net income – this had a particularly dramatic effect on Man Group’s implied multiple. I argued, at the time, that this was too low – principally because, although the fees were volatile and unpredictable, they were never negative, and, if there had been a reasonably broad source of them, they were more resilient than the market was implying. Some things are very persistent!
Further adjustments are needed for any non-core business. We have Frenkel Topping in our database, but we have not included it on this chart. It has an EV/AuM of around 8% – more than double the next highest – but this is because it has a large and profitable legal services business that generates substantial income away from the asset management side. Indeed, we believe it is a very attractive business model: as the CEO Richard Fraser puts it, “we are paid to prospect” for new business.
Multiples of assets? Really?
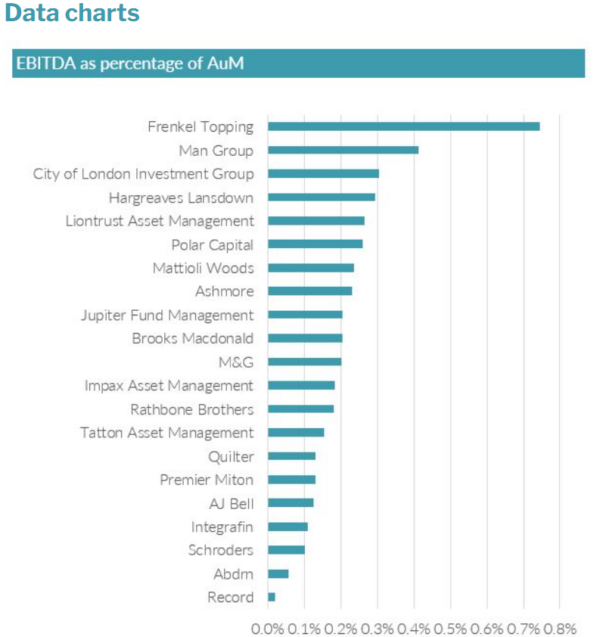
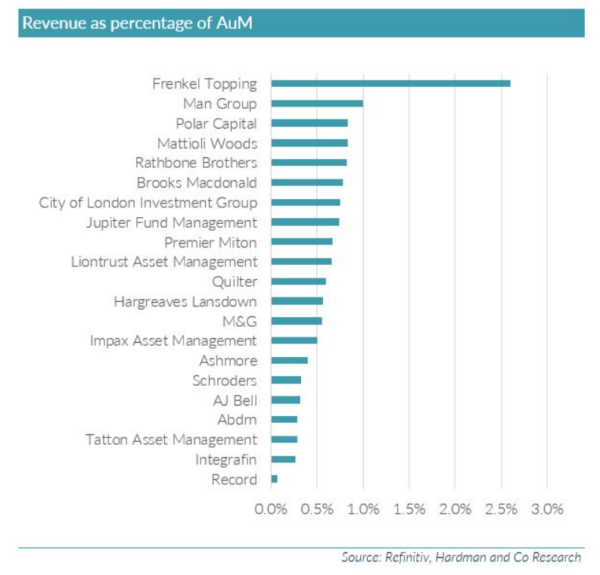
What the chart also demonstrates vividly is that trying to value asset managers on a multiple of assets is pointless. Largely, they range from Record (the currency manager specialist), on 0.1% of AuM, to Ashmore, on 4% (ignoring Frenkel Topping). And, even within that wide band, you get Jupiter and Premier Miton, on 1.7%-1.8%, and Polar and Impax, on 2.8%-2.9%. This is simply not how the market values asset managers. If there is no other information, then finding a manager of a similar style and comparing assets might be useful, but, when you have other information, like the profitability of those assets, it is mad to ignore it.
There are exceptions to this. If you look at just the wealth managers, you will see that they all trade in a very narrow band. Excluding Quilter, the other four all trade at between 2.2% and 2.3% of AuM: a very narrow spread indeed. Tatton and Rathbones trade at a significant earnings premium to Mattioli Woods and Brooks MacDonald. Quilter is an anomaly all round: it actually has a negative enterprise value.
The three platform providers – Hargreaves Lansdown, AJ Bell and Integrafin – trade on a substantial premium to the active managers. But that premium has come down substantially. When I last drew these charts, in October 2021, AJ Bell and Integrafin were on ca.25x market cap to EBITDA, and Hargreaves was on 18.5x. Now, AJ Bell and Integrafin are e on 19x-21x, and Hargreaves is on 13x.
Margins and scale
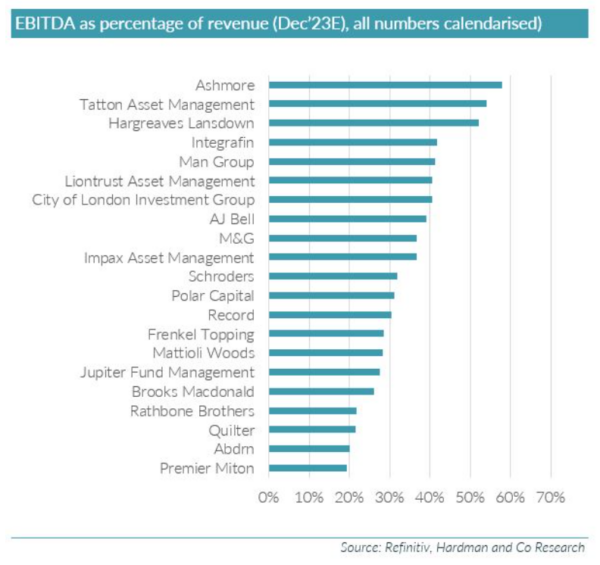
Another thing that never changes is the constant refrain that there is no room for mid-sized fund managers: you have to be either gigantic or a specialist. One of the quirks, though, of the asset management industry is that there is absolutely no correlation between size and profitability. In fact, there is not an inverse correlation, but an issue of specialisation.
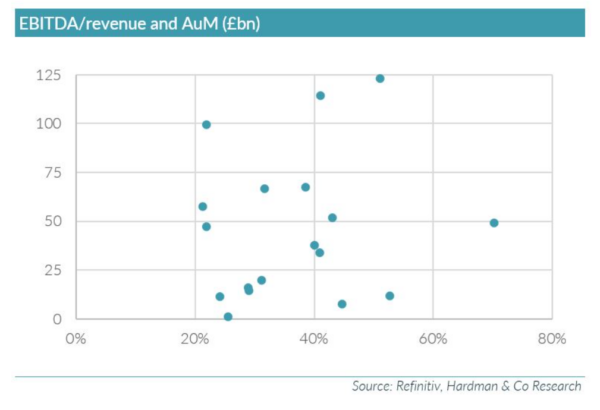
The lowest margins tend to come from managers attempting to manage many different asset classes and strategies, and this frequently derives from acquisitions. The worst offenders are Abdrn (20%), Quilter (20%) and Jupiter (22%). The problem can be exacerbated by continuing outflows – often a symptom of an asset manager built on acquisitions – as the costs never fall as far as the revenues slide away.
Acquisitions
Acquisitions in this sector are generally a poor idea. The key exception is where a business is acquired and transplanted into the new group, and left wholly untouched, and where there is no overlap with the existing expertise; in other words, the opposite of a good acquisition in the industrial world, where the business can be integrated and synergies exploited. In the asset management world, both the staff and the clients are mobile, and are apt to leave if disturbed.
In the days before “open architecture” and the rise of what were then called “fund supermarkets”, and are now known as platforms, clients were remarkably sticky. John Duffield, the founder of both Jupiter and New Star, used to say that he could send a letter to all his investors, saying “John Duffield is a crook”, and 95% would throw it in the bin and the rest would read and ignore it. Now investors are much more fickle, and are best left as “uninterfered with” as possible. Changes of ownership inevitably shake things up, and this is even more true of institutional clients. Professional clients go through a rigorous management selection process, and, if their chosen manager is suddenly acquired, this will almost invariably trigger a review.
Performance
The other trigger for outflows is poor performance. This is an inevitable risk for all active managers, and makes this industry perhaps uniquely volatile. In most businesses, there is substantial, if not total, control over the quality of the product; this is simply not the case for active fund management, if actual performance, rather than process, is being measured. And, even worse, those outflows are likely to be augmented at exactly the wrong moment – when markets are falling.
Consequently, the more attractive parts of the industry, from a valuation perspective, are where investment performance is not the key; hence the premium paid for platforms. A word of warning to those platforms moving into active asset management and advice – it should (and probably will or maybe already has) lead to a derating.
The beauty of the platform model is that, as long as the admin is up to scratch, the clients will stay. The only losses come from natural attrition. And there are scale benefits. Extending the model to providing investment products (or at least non-index products) opens the door to more client dissatisfaction and introduces factors that are much less easily controlled. The wealth managers are somewhere in the middle of this – client admin is by far the most important part of client retention, but there are some investment return issues too.
Growth
One area on which we haven’t focused in this short article is growth. It is a problematic area for forecasting asset managers’ profits. The biggest driver of growth – positive or negative – is markets, and, for analysts making forecasts, there is little point in driving your forecasts with your own idiosyncratic views on the various markets.
There is more scope for forecasting flows – they tend to be more persistent, and the most consistent driver, in my experience at least, has been one-year performance track records. But there are still many external factors that make this area rather hit and miss. Offsetting this, to some extent, is the inertia of the business model – the revenues are a function of the average AuMs during the year, and at least you know the starting point.
Conclusion
The first chart seems to show, to me at least, that there are currently few obvious anomalies out there in the valuations of asset managers, and I’m not going to hold my breath any longer waiting for Man Group to be rerated.
Download the report here >
![]()
Brokers Commentary » Brokers Latest » Commentary » Investment trusts Commentary » Investment trusts Latest » Mutual funds Commentary » Take control of your finances commentary
Leave a Reply
You must be logged in to post a comment.