Jan
2024
Active vs passive: concentrated markets swing the pendulum back in favour of active
DIY Investor
1 January 2024
The data which suggests passive strategies could come unstuck – by Duncan Lamont
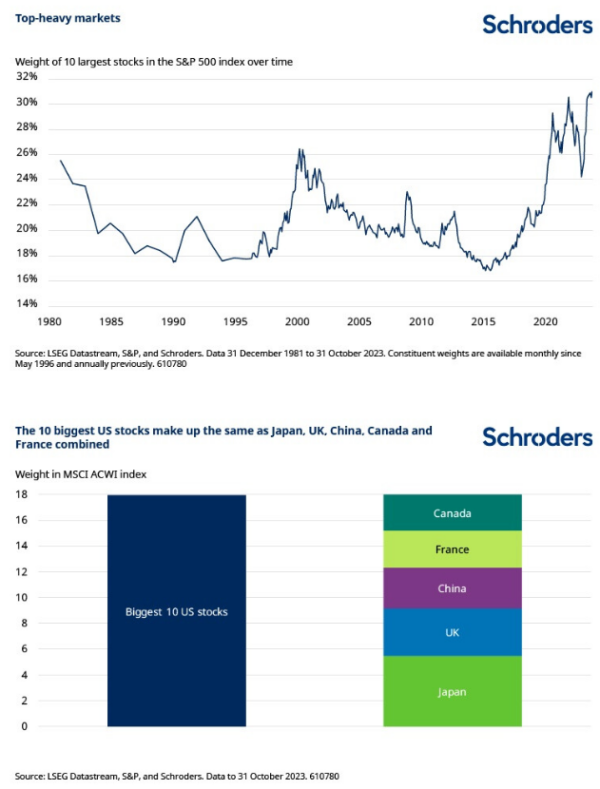
Global stock markets have become increasingly top-heavy. At the end of October, the 10 biggest stocks in the US S&P 500 index made up a record 31% of the market (Figure 1).
This is clearly a problem for investors trying to build diversified portfolios as a significant proportion of their risk is being driven by a relatively small number of companies.
Our new research also shows that, historically, investors passively tracking the US stock market would have lost out on returns in the years following high levels of index concentration.
At a time when investors are increasing allocating to passively managed strategies at the expense of active, the tables could be set to turn.
This is not just an issue for the US stock market. The US has grown to be 63% of the global market at the end of October (MSCI All Country World Index (ACWI) index) so international investors have ended up with a lot in US stocks and, with that, a lot in just 10 stocks. Those 10 make up nearly 18% of the global market, the same as Japan, the UK, China, France, and Canada combined.
Should investors worry about index concentration when it comes to future returns?
One way to assess this is to compare the performance of a standard market cap-weighted index and its equal-weighted cousin.
For those less familiar, the equal-weighted version of the S&P 500 has 1/500 = 0.2% in every stock in the index. It has 2% in the 10 largest stocks rather than 31%. It is a more diversified version of the market.
If the equal-weighted S&P 500 is outperforming the standard S&P 500, that means that the bigger stocks are underperforming the smaller stocks within the index – and vice-versa. It means investors would be better served by allocating money away from the biggest stocks that most passive portfolios have the greatest exposure to.
Deviating from the market has been a winning strategy when concentration has been high
Our new research finds that, in the past, there has been a strong, statistically significant, relationship between the degree of concentration in the S&P 500 and how the equal-weighted S&P 500 has performed relative to the S&P 500.
The higher the concentration, the greater the outperformance of the equal-weighed S&P over the next five years (Figure 3). Deviating from the market has been a winning strategy when concentration has been high. The relationship has been weaker, though still positive when assessed over shorter investment horizons.
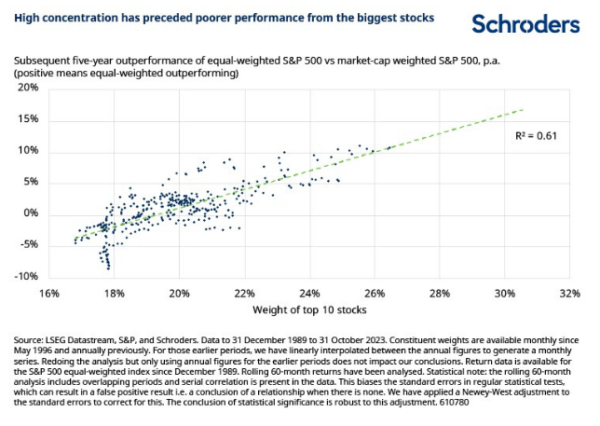
Based on today’s 31% weight for the 10 largest stocks, this relationship suggests that the equal-weighted S&P 500 could outperform by more than 15% a year over the next five years.
This is a strong argument that the passive, market cap-weighted, strategy favoured by many could struggle compared with others which have more freedom to deviate from such concentrated exposure.
Now, of course, this time may be different. And we are in uncharted territory to an extent. There are no data points to corroborate whether the gradient of the line will remain the same as we get further over to the far right hand side of the chart.
However, even if the magnitude is up for debate, the broad conclusion appears more robust: when the market has become very concentrated in a few stocks, investors have done better by allocating away from those stocks. The tables could be set to turn in favour of more actively managed strategies at last.
![]()
Important information
This communication is marketing material. The views and opinions contained herein are those of the named author(s) on this page, and may not necessarily represent views expressed or reflected in other Schroders communications, strategies or funds.
This document is intended to be for information purposes only and it is not intended as promotional material in any respect. The material is not intended as an offer or solicitation for the purchase or sale of any financial instrument. The material is not intended to provide, and should not be relied on for, accounting, legal or tax advice, or investment recommendations. Information herein is believed to be reliable but Schroder Investment Management Ltd (Schroders) does not warrant its completeness or accuracy.
The data has been sourced by Schroders and should be independently verified before further publication or use. No responsibility can be accepted for error of fact or opinion. This does not exclude or restrict any duty or liability that Schroders has to its customers under the Financial Services and Markets Act 2000 (as amended from time to time) or any other regulatory system. Reliance should not be placed on the views and information in the document when taking individual investment and/or strategic decisions.
Past Performance is not a guide to future performance. The value of investments and the income from them may go down as well as up and investors may not get back the amounts originally invested. Exchange rate changes may cause the value of any overseas investments to rise or fall.
Any sectors, securities, regions or countries shown above are for illustrative purposes only and are not to be considered a recommendation to buy or sell.
The forecasts included should not be relied upon, are not guaranteed and are provided only as at the date of issue. Our forecasts are based on our own assumptions which may change. Forecasts and assumptions may be affected by external economic or other factors.
Issued by Schroder Unit Trusts Limited, 1 London Wall Place, London EC2Y 5AU. Registered Number 4191730 England. Authorised and regulated by the Financial Conduct Authority.
Commentary » Exchange traded products Commentary » Investment trusts Commentary » Latest » Mutual funds Commentary
Leave a Reply
You must be logged in to post a comment.