Dec
2023
A bull and bear case for 2024
DIY Investor
7 December 2023
By Russell Shor, Senior Market Specialist at FXCM
To summarise:
- For the bullish case to evolve, there are fundamental factors that the market will expect to see. Firstly, inflation will need to decline towards the Fed’s target of 2% without growth being affected. In other words, the disinflationary environment should continue at a healthy pace with economic growth remaining resilient, contributing to corporate earnings.
-
In terms of a bear market, the chances for this scenario will increase if economic growth slows meaningfully and then tends towards contraction. The catalyst for this potential is the currently higher interest rates which weigh on economic activity.
-
If this plays out, it will be a bigger impediment to growth and if disinflation slows and becomes sticky, stagflation will become a risk. This will then filter through to corporate earnings and pressure will mount, with the stock market in jeopardy of decline.
-
The CME FedWatch Tool currently indicates a possible 25 basis point rate cut in March 2024 and a 125 basis point cut by December 2024. If this is due to inflation returning to target, with growth maintaining, the bullish scenario is preferred. However, if the cuts do not materialise, the bear case becomes a stronger probability.
Introduction
The S&P 500 (SPX500) has experienced a good 2023 so far. It is up over 18% with a month left of the year. As we move toward next year, it is normal to ponder the outlook for 2024. However, prediction is always fraught with danger because nobody knows the future with any certainty. In the following article, I will explore two possible market scenarios – a bull market for 2024, and then a potential bear market. I will outline what I think the appropriate charts and fundamentals will be for each case. It is my hope that this will help with key yardsticks and signposts that will help determine which way the market is moving.
To help with the chart explanation, it is important to consider the SPX500’s primary trend.
The Primary Trend
The primary trend is the broader market movement, generally referred to as a bull or bear market, that tends to unfold over the longer term. A bull market will be interrupted by secondary corrections to the downside, whilst a bear market tends to be interrupted by noteworthy rallies. These interruptions may last from a few weeks to several months before the primary trend resumes.
The Bull Case – Chart
To use the primary trend as a data tool to help assess 2024’s bull outlook, it is worth determining the trend. Dow theory, the precursor to technical analysis, suggests that a higher trough and then a higher peak are needed before a bull trend is determined.
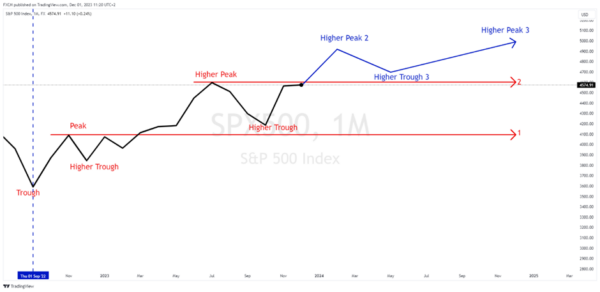
Chart 1
Chart 1 is a long-term monthly chart. It shows that, since September 2022 (blue dashed vertical), the SPX500 has charted a higher trough followed by a higher peak. The higher peak was registered as soon as the index moved above the red horizontal trend line 1. In fact, it charted another higher trough in October 2023. This puts the SPX500 into a defined uptrend or bull market.
The index is now approaching red horizontal trend line 2 (around the 4,600 level) and if it moves above it, the index will have charted a series of higher troughs followed by higher peaks.
The blue lines indicate the hypothetical 2024 bull scenario where higher trough 3 is followed by higher peak 3, with 2024 ending close to the 5,000 level. In this case, the bull trend has continued and the SPX500 has charted a series of higher troughs followed by higher peaks. However, there are some fundamental aspects which need to be considered, which will help the bull case.
The Bull Case – Fundamental Aspects
For the bullish case to evolve, there are fundamental factors that the market will expect to see. Firstly, inflation will need to decline towards the Federal Reserve’s target of 2% without growth being affected. In other words, the disinflationary environment continues at a healthy pace with economic growth remaining resilient, contributing to corporate earnings.
In this scenario, yields decline as inflation returns to target and not because of recessionary fears or the need for expansionary policy. In effect, interest rates are less restrictive and contribute to stock value via the time value of money mechanism.
The Bear Case – Chart
To use the primary trend as a data tool to help assess 2024’s bear outlook, again it is worth determining the trend. Dow theory suggests that a lower peak and then a lower trough are needed before a bear trend is determined.
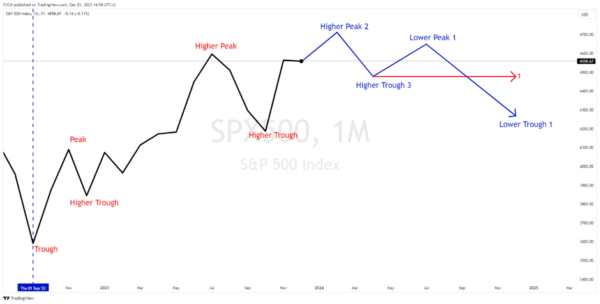
Chart 2
In chart 2, 2024’s hypothetical bear trend is represented by the blue trend lines. In this case, lower peak 1 is followed by lower trough 1, which is the definition of a bear market. As soon as the index drops below higher trough 3 at red horizontal line 1, the bear market begins.
The Bear Case – Fundamental Aspect
The chances for the bearish scenario will increase if economic growth slows meaningfully and then tends towards contraction. The catalyst for this potential is the currently higher interest rates which weigh on economic activity. Moreover, there has been Federal Reserve talk of “higher for longer.” i.e. keeping rates at restrictive levels for a sustained period. If this plays out, it will be a bigger impediment to growth and if disinflation slows and becomes sticky, stagflation will become a risk. This will then filter through to corporate earnings and pressure will mount, with the stock market in jeopardy of decline.
Conclusion
The market is starting to price in rate cuts for 2024. The CME FedWatch Tool indicates a possible 25 basis point rate cut in March 2024 and an astounding 125 basis point by December 2024. If this is due to inflation returning to target, with growth maintaining, the bullish scenario is preferred. However, if the cuts do not materialise and we see the “higher for longer” paradigm or if cuts become necessary due to recessionary pressure, the bear case becomes a stronger probability. It is a question of ordered disinflation or recessionary pressure.
Leave a Reply
You must be logged in to post a comment.