Mar
2022
16 years of returns: History’s lesson for investors
DIY Investor
22 March 2022
 This graphic shows the best and worst performing assets each year since 2006, and shows the powerful benefits of diversifying your investments by David Brett
The temptation among investors is to stick with what you know. That is no bad thing. It is a strategy championed by successful investment pioneers such as Warren Buffett, a famous devotee of stocks.
It can work, when the market is rising and you have picked the right asset. However, it’s also important for investors to consider the merits of diversification. The value of this approach is highlighted when – as with the pandemic in 2020 – entirely unexpected events can throw economic and market expectations into sudden disarray.
This table underlines the importance of spreading your money across different asset classes. This can potentially help reduce risk and maybe even improve the long-term performance of your overall portfolio. It shows the returns achieved by some of the main asset classes in each year.
As the table makes clear, past performance is not a guide to future performance and may not be repeated.
Stock market performance is measured by the MSCI World Total Return index. Investment grade bonds relate to global government and corporate bonds deemed to be at relatively low risk of default. Property relates to the returns from global real estate markets as measured by Thomson Reuters. More detail on the indices used for each asset can be found at the foot of the table.
Asset class performance 2006-2021
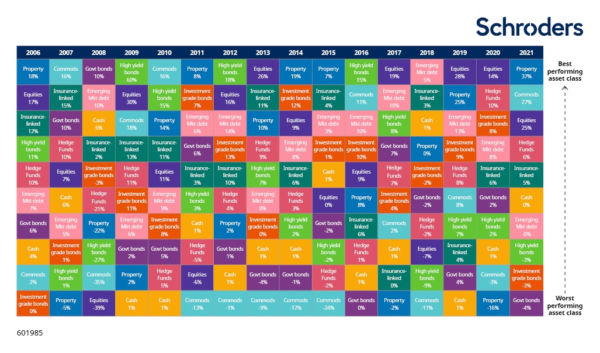
Past performance is not a guide to future performance and may not be repeated. Source: Source: Schroders, Datastream as of 31 December 2021. Equity: MSCI AC World Total Return Index. Property: UK IPD Index. Hedge funds: HFRI Funds of Funds Composite Total Return Index. Cash: 3 month Sterling LIBOR. Global HY: BofA Merrill Lynch Global High Yield TR Index; Sterling IG: IBoxx UK Sterling Non-Gilts All Maturities. Govts: Barclays Global Treasury Index. Property: UK IPD Index. Commodities: Bloomberg Commodity Index. EMD: JPM GBI-EM Composite Index. ILS: Swiss Re Cat Bond Index. All show total return either in local currency or currency of denomination.
What are the benefits of diversification?
The table reflects how the fortunes of different assets often diverge.
Take the historic performance of equities, which typically make up a large portion of investors’ portfolios. Their performance is often unrelated to (or not “correlated” with) the performance of government bonds. In other words good years for equities, such as 2013 (+26%), 2019 (+28%) and 2020 (+14%), were also comparatively poor years for bonds (–4%; +4%; +2%).
The opposite is true in that good years for government bonds tended to be poor for equities. In the case of 2008, for example, which was the epicentre of the financial crisis, government bonds were the highest-performing asset class returning 10%, while equities were the worst, falling 39%.
The table also shows how some asset classes, for example cash, demonstrate relatively consistent nominal returns year after year. These may not be exciting, but they offer defensive characteristics where investors seek to protect themselves from the more volatile categories where performance leaps about the chart year on year.
The benefits of diversification can be described in various ways:
Managing risk: A crucial imperative for investors is not to lose money. There is risk with every investment – the risk that you receive back less than you put in or the probability that it will deliver less than you had expected. This risk varies by the type of investment. Holding different assets mean this risk can be spread. It could also be managed by you or by a professional, such as a financial adviser. Specialist fund managers can also allocate money to help manage risks.
Retaining access to your money: The ease with which you can enter or exit an investment is important. Selling property can take a long time compared with selling equities, for example. Holding different types of investments that vary in terms of “liquidity” (the ease of buying and selling) means you can still sell some of your investments should you suddenly need money.
Smoothing the ups and downs: The frequency and magnitude by which your investments rise and fall determines your portfolio’s volatility. Diversifying your investments can give you a greater chance of smoothing those peaks and troughs.
Johanna Kyrklund, Global Head of Multi-Asset Investments at Schroders, said: “For me, the merits of diversification cannot be emphasised strongly enough. I’ve been a multi-asset investor for more than 20 years and have inevitably faced some pretty turbulent spells for markets. Each time, the ability to nimbly move between different types of assets has better equipped me to navigate those periods.”
“Diversification, if carefully and constantly managed, can potentially deliver smoother returns; it’s a key tool to help in balancing the returns achieved versus the risks taken.”
Too much diversification? There is no fixed rule as to how many assets a diversified portfolio should hold: too few can add risk, but so can holding too many.
Hundreds of holdings across many different types of investment can be hard for an individual investor to manage.
![]()
Important information
This communication is marketing material. The views and opinions contained herein are those of the named author(s) on this page, and may not necessarily represent views expressed or reflected in other Schroders communications, strategies or funds.
This document is intended to be for information purposes only and it is not intended as promotional material in any respect. The material is not intended as an offer or solicitation for the purchase or sale of any financial instrument. The material is not intended to provide, and should not be relied on for, accounting, legal or tax advice, or investment recommendations. Information herein is believed to be reliable but Schroder Investment Management Ltd (Schroders) does not warrant its completeness or accuracy.
The data has been sourced by Schroders and should be independently verified before further publication or use. No responsibility can be accepted for error of fact or opinion. This does not exclude or restrict any duty or liability that Schroders has to its customers under the Financial Services and Markets Act 2000 (as amended from time to time) or any other regulatory system. Reliance should not be placed on the views and information in the document when taking individual investment and/or strategic decisions.
Past Performance is not a guide to future performance. The value of investments and the income from them may go down as well as up and investors may not get back the amounts originally invested. Exchange rate changes may cause the value of any overseas investments to rise or fall.
Any sectors, securities, regions or countries shown above are for illustrative purposes only and are not to be considered a recommendation to buy or sell.
The forecasts included should not be relied upon, are not guaranteed and are provided only as at the date of issue. Our forecasts are based on our own assumptions which may change. Forecasts and assumptions may be affected by external economic or other factors.
Issued by Schroder Unit Trusts Limited, 1 London Wall Place, London EC2Y 5AU. Registered Number 4191730 England. Authorised and regulated by the Financial Conduct Authority.
Brokers Commentary » Brokers Latest » Equities » Equities Commentary » Equities Latest » Exchange traded products Commentary » Exchange traded products Latest » Exchange traded products Video » Fixed income Commentary » Fixed income Latest » Investment trusts Video » Latest » Mutual funds Commentary » Mutual funds Video » Take control of your finances video » Video » Video General » Video Latest
Leave a Reply
You must be logged in to post a comment.