Jun
2025
Stay calm, stick to your plans and be open to opportunities
DIY Investor
29 June 2025
Global conflict is familiar to most investors, but that does not stop a shocked reaction when a new flashpoint emerges. So here is some data that can help you keep a cool head amidst the tumult – by Duncan Lamont
Shock headlines announce new outbreaks of conflict. Uncertainty takes hold, markets react and the financial fallout is mainstream news. This is my pension, my housing deposit, my children’s savings, my client’s savings. We’ve been here before. But it feels different. It ALWAYS feels different.
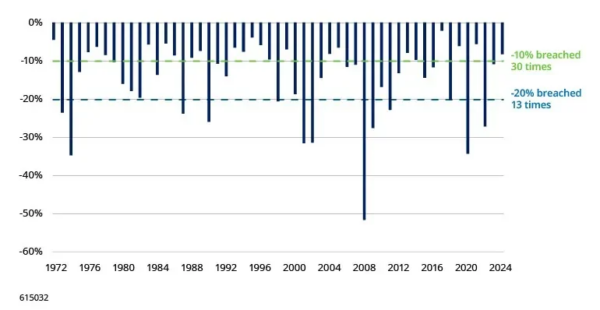
Crises happen. The stock market falls 20% once every four years, on average, 10% most years. It’s easy to forget this. Even if you’re a seasoned investor, how much comfort does that give you when you’re in the thick of it?
The simple reality is that the stock market has tremendous power to help grow wealth in the long-run but short-term volatility and risk of falls are the price of the entry ticket.
Are you able to think back to the fact that the global stock market has more than doubled the value of your savings in the last five years? If you’d sat in cash you’d only be up 14%. $10,000 invested in the stock market would be worth $20,700 today compared with only $11,400 in cash (data for the five years to 4 April 2025).
It takes incredible self-control to be so objective and emotionally detached. It’s easy to say “don’t worry” – but that’s not how most of us are wired.
But what we can do is turn to objective, data-driven analysis to help temper that emotional response. To shift from a knee-jerk reaction to a more logical and reasoned one. For most investors, the best course of action will be to stay calm, stick to your plan and, rather than be scared by volatility, to be alive to the opportunities that it may present.
1. 10%+ falls happen in more years than not, 20% falls happen once every four years
Taking world stock markets (as represented by the MSCI World Index) 10% falls happened in 30 of the 53 calendar years prior to 2025. In the past decade, this includes 2015, 2016, 2018, 2020, 2022 and 2023.
More substantial falls of 20% occurred in 13 of the 53 years (once every four years, on average – but if it happens this year, that will be four times in the past eight years, in 2018, 2020 and 2022).
Biggest stock market falls in each of the past 53 calendar years, MSCI World (USD)

Despite these regular bumps along the way, the US market has delivered strong average annual returns over this 53 year period overall.
2. Stock market investing is very risky in the short run but less so in the long run – unlike cash
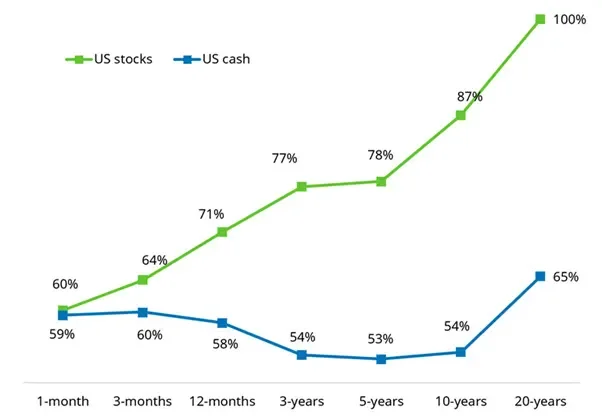
Using almost 100 years of data on the US stock market, we found that, if you invested for a month, you would have beaten inflation 60% of the time but fallen short of it 40% of the time. This is a similar success rate to cash.
Percentage of time periods where US stocks and cash have beaten inflation 1926-2024

Past performance is not a guide to future performance and may not be repeated.
Source: Stocks represented by Ibbotson® SBBI® US Large-Cap Stocks, Cash by Ibbotson® US (30-day) Treasury Bills. Data to December 2024. Morningstar Direct, accessed via CFA institute and Schroders.
But, if you had invested for longer, the odds would shift dramatically in your favour. On a 12-month basis, the stock market has beaten inflation 70% of the time. Importantly, 12-months is still the short-run when it comes to the stock market. You’ve got to be in it for longer to benefit most.
On a five-year horizon, that success rate rises to nearly 80%. At 10 years it is approaching 90%. And there have been no 20-year periods in our analysis when stocks have failed to beat inflation.
Losing money over the long run can never be ruled out entirely and would clearly be very painful if it happened to you. However, it is also a very rare occurrence.
In contrast, while cash may seem safer, the chances of its value being eroded by inflation are much higher. The last time cash beat inflation in any five-year period was February 2006 to February 2011, a distant memory.
3. Being spooked by volatility could cost you in the long run
The stock market’s “fear gauge”, the Vix index, has spiked during 2025 to date. The Vix is a measure of the amount of volatility traders expect for the US S&P 500 index in the next 30 days. On Friday it closed at a level of 45, well above the long-term average of 19.
However, historically, it would have been a bad idea for investors to sell out during periods of heightened fear.
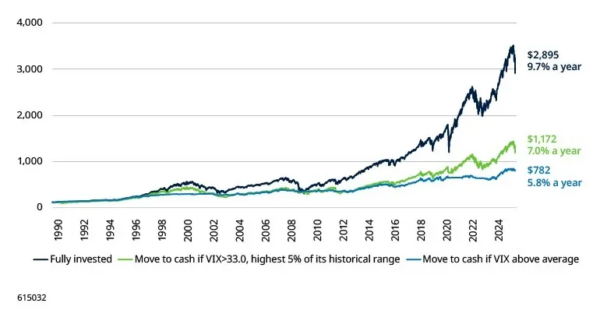
We looked at a switching strategy, which sold out of stocks (S&P 500) and went into cash on a daily basis whenever the Vix was above 33, then shifted back into stocks whenever it dipped back below. 33 is a level where it has only been above 5% of the time, so I’ve used it to represent a “high” reading.
This approach would have returned 7.0% a year (ignoring any costs), significantly underperforming a strategy which remained continually invested in stocks, which would have returned 9.7% a year, again excluding costs.
If you are someone who gets nervous quickly, and are tempted to sell whenever the Vix goes above average, you’d have fared even worse.
Growth of $100 fully invested in stocks vs switch to cash when VIX high

Past performance is not a guide to the future and may not be repeated.
Note: Levels in excess of 33.0 represent the top 5% of experience for the VIX. Portfolio is rebalanced on a daily basis depending on the level of the VIX at the previous close. Equity index is S&P 500, cash is 30-day cash. Data to 4 April 2025. Figures do not take account of any costs, including transaction costs. Source: CBOE, LSEG Datastream, Schroders
What to bear in mind now
This gets personal, and only you know what is right for you and your clients, as no two circumstances are identical. While the past is not necessarily a guide to the future, history suggests that those who responded to market risk with knee-jerk reactions often missed out. Increasing risks around the world – from geopolitical instability to trade uncertainty – can make investors uneasy, but for long-term investors, staying calm and disciplined, and sticking to your plan, is often the most effective approach.
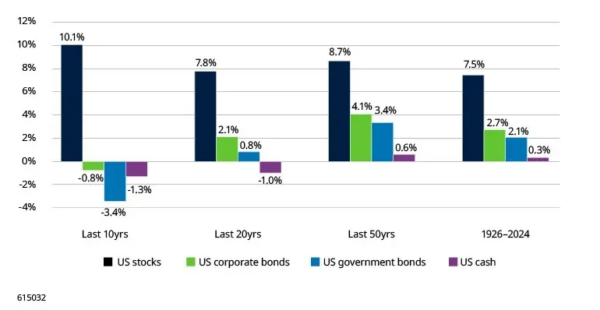
There is always a reason to worry but, in the long run, stocks have beaten bonds which have beaten cash
US asset returns in excess of inflation 1926-2024

Past performance is not a guide to the future and may not be repeated.
Data to December 2024. 1926-2023: stocks represented by Ibbotson® SBBI® US Large-Cap Stocks, Corporate bonds by Ibbotson® SBBI® US Long-term Corporate Bonds, Government bonds by Ibbotson® SBBI® US Long-term Government Bonds, and Cash by Ibbotson® US (30-day) Treasury Bills. For 2024, an alternative index has had to be used for government bonds as Morningstar has halted data updates and production for the SBBI Indices. The ICE BofA 10+ Year US Treasury Index has been chosen for consistency. Source: Morningstar Direct, accessed via CFA institute, LSEG Datastream, ICE Data Indices, and Schroders
Any reference to regions, countries, sectors, stocks or securities is for illustrative purposes only and not a recommendation to buy or sell any financial instruments or adopt a specific investment strategy.
Past performance is not a guide to future performance and may not be repeated.
Published by our friends at:

Leave a Reply
You must be logged in to post a comment.