Jun
2024
Are we underestimating the impact of climate change?
DIY Investor
29 June 2024
Concerns around the growing impact of physical risks associated with global warming call for a more in-depth analysis of their potential economic consequences – by Irene Lauro and Samar Khaana
Global average surface temperature rose to 1.45°C above pre-industrial levels in 2023, making the year the warmest on record. As global warming intensifies, extreme weather events have become more frequent and their economic damage more significant. With climate change becoming a more pressing issue, it is extremely important for investors to understand its impacts on the economy when making asset allocation decisions.
This is not new. But what is, is that climate scientists are forecasting things will get a lot worse a lot sooner than many mainstream economic models predict. Economies and financial markets face greater downside risks. There is uncertainty in all of these projections, and this is only one possible scenario. But investors should understand how their portfolios could fare if the forecasts of climate scientists materialise, and what steps they can take today to mitigate against the risks.
What do popular economic models predict?
While there is a strong consensus that a warmer world means a poorer global economy, economic estimates tend to lie in a very broad range. This is unsurprising given the high degree of uncertainty surrounding future climate scenarios and the deep link of various sectors and ecosystems. For example, the total loss in global GDP by 2100 with a 4°C warming is estimated to be between 4% and 23% (chart 1). Here we show the estimated impact of higher temperatures in recent economic studies.
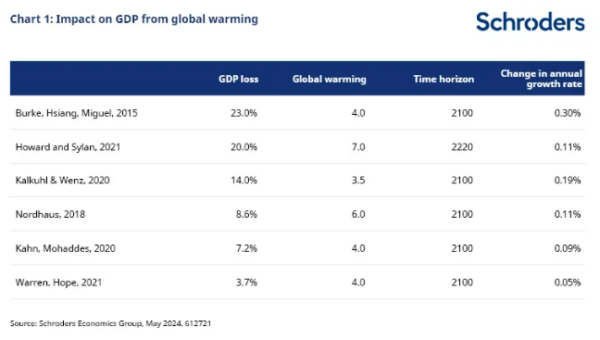
It is important to highlight that while a 23% drop in GDP might seem a big hit to the economy, when looking at the annual damage, the economic cost is estimated to be less than 0.4% per year, even in the most severe case estimated by economists.
This is in contrast with expectations of climate scientists, who are forecasting mass extinction (i.e. the end of much life on earth) if temperatures rise more than 5°C from preindustrial levels. While 5°C would be towards the upper end of the figures in the table above, the impact on GDP would obviously be far greater than any of these figures suggest.
A group of international scientists from the Potsdam Institute for Climate Impact Research and the Stockholm Resilience Centre predict that even at 1.5°C economic models are overlooking the true degree of risk. There is a significant likelihood at these temperatures of passing multiple climate tipping points, particularly around major ice sheets. When large parts of the climate system cross a warming threshold and start to change by themselves, this is called a tipping point. It can lead to serious consequences, such as a big increase in sea levels from melting ice sheets and carbon emissions from frozen ground that thaws. Another international team of scientists predicts that even if the carbon emission reductions called for in the Paris Agreement are met there could be a severe climate impact. For instance, within the Paris scenario there is a risk of Earth entering what they call “Hothouse Earth” conditions, where sea levels would increase by 10-60 metres.
Revising the damage from climate change
There are growing concerns that current economics models, including those we use in our own 30-year return forecasts, may be underestimating the risks of climate change.
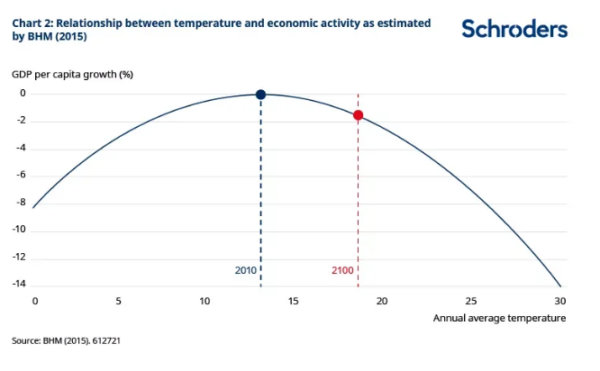
For our 30-year returns forecasts, a “damage function” incorporates the economic impact of climate change via the long-term productivity forecasts. The one we use is derived from the methodology of Burke, Hsiang, and Miguel (BHM; 2015). This function shows a non-linear relationship between productivity growth and average temperature.
Hotter countries are hurt by higher temperatures but, as explained in our 30-year returns paper, “cold country” productivity is assumed to increase as annual temperatures increase (chart 2). This relationship suggests that climate change is set to create winners and losers, as economies with a low temperature are forecast to see a boost on the back of a warmer world, while warmer countries suffer.
However, there are growing arguments from climate scientists that the physical risks of climate change could be much higher and be distributed differently around the planet. This is primarily due to a combination of two factors. Firstly, confidence is increasing among climate scientists that, as temperatures rise more than 2°C above the pre-industrial level, the global economy is likely to be negatively impacted by changes in the physical environment.
As highlighted by a recent academic study, scientists are now more confident that rising temperatures will result in stronger tropical cyclones, extreme heat impacts, more frequent and intense floods and droughts. In addition, they increasingly believe global warming will result in the destabilisation of ice sheets and glaciers and consequent sea level rises.
Secondly, most of the damage functions used by policy makers to quantify the risk the economy faces as a result of climate change only look at global average surface temperatures. They exclude other important measures, such as temperature volatility. This matters as temperature volatility directly impacts the frequency and severity of extreme weather events. As will be discussed in the next section, this second factor could have a profound and negative impact on the outlook for colder countries in particular. Developed markets would be the worst affected.
Our joint research with Oxford Economics introduces a revised damage function that incorporates these temperature anomalies (i.e. deviations from long-term temperature averages), in addition to temperature averages. This allows us to consider factors like temperature volatility and extreme weather events – giving us a clearer picture of the shape of temperature distribution beyond the mean.
By accounting for temperature anomalies, volatility and skewness in temperature distributions, the damage function produces a more severe relationship with economic activity, with important implications for the growth-inflation outlook of the economy.
Climate downside scenario
Our Climate Downside scenario is developed on the revised damage function. This approach aims to create a scenario that, while severe, remains within the realm of possibility. Our ultimate goal is to explore what a climate downside scenario might look like. Investigating alternative damage functions is one of the ways to examine potential future trajectories associated with climate downside risks.
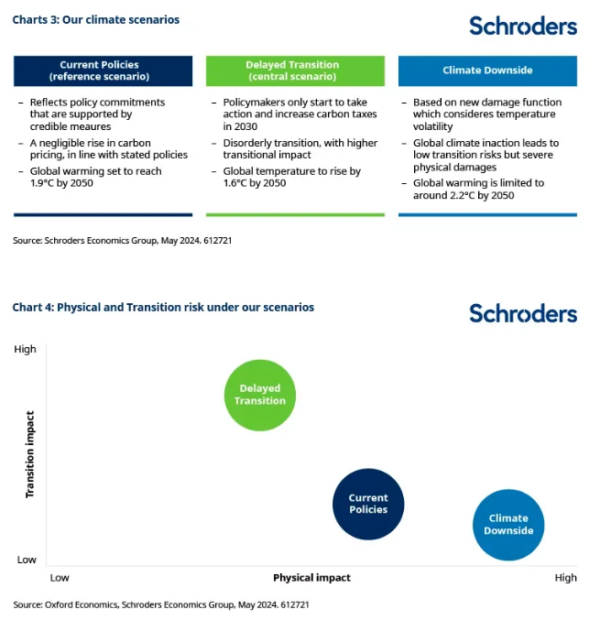
Chart 3 shows how physical and transition risks play out in our scenario analysis. Physical risks are as the name implies. Transition risks are the economic consequences of actions taken to move to a lower temperature trajectory.
In our Climate Downside scenario, transition risks are low as it is assumed that governments will fail to take the actions necessary to meet their climate objectives i.e. there will not be much of a transition. This failure results in an energy landscape that continues to be heavily dependent on fossil fuels with oil, gas and coal production increasing until 2050. In reality, the severe consequences of such a scenario mean that the likelihood of it generating no response is low. However, it can be useful to understand the scale of the impact if it did come to pass.
In contrast, in the Delayed Transition scenario which we used as our baseline for our 30-year forecasts, we manage to somewhat meet our net-zero objectives. But because the government delays its action, the transition is chaotic, harmful, and expensive, resulting in a much higher impact due to increased carbon pricing, even though the physical damages are lower.
The low level of climate ambition in the Climate Downside scenario is reflected in higher global warming. In this scenario, temperatures are expected to rise to around 2.2°C by 2050, higher than 1.9°C in Current Policies and 1.6°C in Delayed Transition. As a result, physical costs are more severe.
Impact on GDP
The higher level of warming and the adoption of a damage function with temperature anomalies lead to a more significant impact on global GDP. There is a 20% decline in global GDP under the Climate Downside scenario relative to Current Policies scenario by 2050 (chart 5). The decline in GDP expected in the Delayed Transition relative to Current Policies is around 4% by 2050, as the hit to the economy from a sudden and steep rise in carbon prices is mitigated by less severe physical risks.
It is also important to note that physical risks rise sharply over our forecast horizon in our new scenario as higher temperatures lead to higher temperature volatility. Consequently, there are more frequent extreme events, with the decline in GDP becoming more significant after 2040.

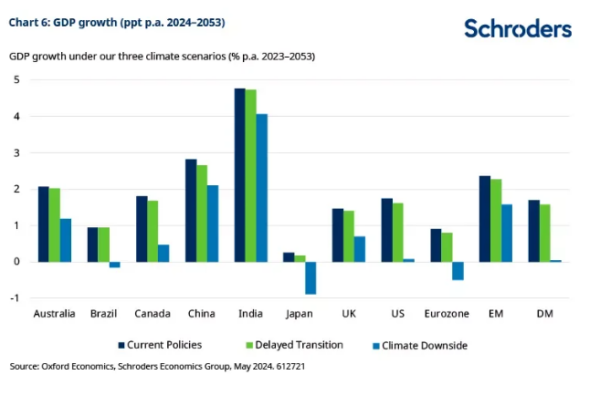
In the Climate Downside scenario, the hit to the global economy is now larger as all economies are expected to see a drop in GDP, as shown in chart 6. With the application of the revised damage function, a number of cold countries – which coincidently happen to be most of the developed economies – face more severe economic damages. This is different to standard approaches, such as the BMH model, which imply that colder countries will benefit from initial warming.
Canada, the US and the eurozone are forecast to see the largest hit to GDP in Climate Downside compared with the Delayed Transition. This is due to the fact that they are likely to warm up faster than others, being closer to the Artic, the fastest warming region of the planet. A quicker rise in temperature for regions in the northern hemisphere means higher temperature anomalies and volatility and therefore more severe extreme weather events hitting these economies.
The eurozone, Japan and Brazil are forecast to have outright negative growth over the next 30 years in this scenario. The US is barely positive. The downside risks should not be underestimated.
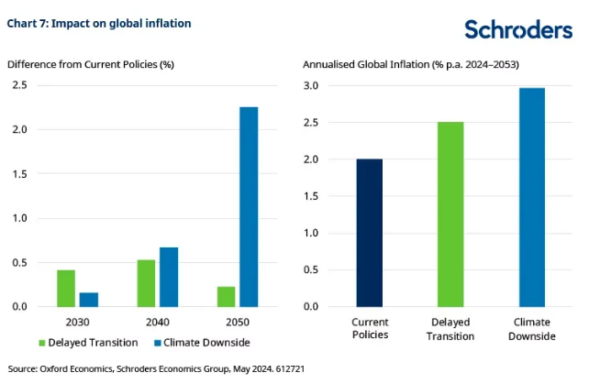
What does it mean for inflation?
Transition and physical risks have a significant effect on economic output, and they will also influence inflation. The impact on inflation is initially much higher in Delayed Transition than in Climate Downside. This is because in the transition scenario, we see a sharp rise in carbon prices starting from 2030, that leads to escalating energy prices. As economies tend to move away from fossil fuels and start to rely more on cleaner energy sources, the impact on inflation declines in the transition scenario.
In comparison, inflation tends to increase in our Climate Downside scenario over the next decades due to the escalation of temperature rises and the greater volatility in temperature changes. More frequent extreme events lead to resource scarcity, notably around the availability of water, arable land, and certain commodities, which results in cost-push inflation. As temperatures rise, input prices follow suit, leading to a supply-side shocks that intensify over our forecast horizon.
What it means for investors – the impact on 30-year returns
Changes in economic activity impacts our long-term return forecasts. Higher inflationary pressures in Climate Downside means higher nominal returns. If we strip out the inflationary impact, real returns provide a clearer picture to the risks to asset class returns, as shown in chart 8.
Most notably, given the hit to economic activity expected for developed markets, annualised real equity returns for the US and other developed markets are nearly half of what they were under the Delayed Transition scenario. Emerging market equity returns are also lower, but it is developed markets that suffer most. Real cash returns in the G4 economies are negative over our 30-year forecast horizon.
Real risk-adjusted returns are lower across the board in this scenario. In it, our analysis suggests investors will find it increasingly challenging to generate returns in excess of inflation at the levels they may be hoping for. This highlights the importance of incorporating physical risks in strategic asset allocation decisions.

From an asset allocation perspective, the balance shifts in favour of emerging market equities over developed markets in this scenario. A stagflationary environment is also likely to make bonds a less reliable diversifier of equity risk. As we have been arguing in recent years, investors will need to consider a broader range of assets to manage risk in portfolios. This includes commodities, which we believe can be compatible with sustainable approaches to investing.
We would also hope this analysis serves as a wake-up call. Rather than the relative lack of response from policy makers which is assumed in this scenario. One would hope that physical consequences on such a scale would spur a reaction, albeit things may need to get worse to force this response. An investment boom in climate mitigation (how we fight climate change) and climate adaptation (how we adapt to/cope with climate change) would follow, benefitting investment strategies focussed in these areas.
Conclusion
The future we face is fraught with uncertainty, a condition further exacerbated by climate change. Our most likely scenario remains one of a costly and disorderly transition – our Delayed Transition scenario. However, our analysis reveals that the exclusive focus on average temperature in current models could lead to a substantial underestimation of the impact of global warming on the economy and financial markets.
As a result, there is a need to explore the Climate Downside scenario. Our analysis offers a more nuanced understanding of climate downside risks, suggesting that we may be underestimating the potential for damage and, by extension, are underhedged against these risks. This has profound implications for investment decisions, underscoring the need for a recalibration of risk assessments and asset allocations in light of these emerging threats.
The alternative scenario presented in this paper also has important implications for policy makers. In particular, our results highlight a more stagflationary outlook for the global economy. Climate-induced shocks heavily impact productivity, leading to major declines in capital and output, but also lead to higher inflation as climate disasters bring substantial changes to cost structures. Lower output will be coupled with higher marginal costs, driving up inflation. This is set to create severe challenges for central banks, increasing the trade-off between the objective of stabilising inflation and supporting growth.
As we have made clear, our new climate scenario does not allow for any policy response to deteriorating conditions and heightened physical risks, so is a “glass half-empty” view from this perspective. However, it is worth highlighting that we are also addressing only some of the risks currently missing from current economic models. So, while we have incorporated the impact of higher temperature volatility on the economy, bringing us more in line with predictions from climate scientists, some key risks are still missing from the assessment.
Changes in migration patterns, the release of greenhouse gases from important carbon sinks like oceans and forests, the destruction of biodiversity and the collapse of ecosystems are all factors that will have a profound impact on the economy. For now, however, they remain unaccounted for in this analysis. This suggests that there is still more to be done to get a more complete picture of the challenges we face. This is required to enable investors, policy makers, and stakeholders to make informed decisions that account for the full range of potential outcomes associated with a warmer world.
![]()
Important information
This communication is marketing material. The views and opinions contained herein are those of the named author(s) on this page, and may not necessarily represent views expressed or reflected in other Schroders communications, strategies or funds.
This document is intended to be for information purposes only and it is not intended as promotional material in any respect. The material is not intended as an offer or solicitation for the purchase or sale of any financial instrument. The material is not intended to provide, and should not be relied on for, accounting, legal or tax advice, or investment recommendations. Information herein is believed to be reliable but Schroder Investment Management Ltd (Schroders) does not warrant its completeness or accuracy.
The data has been sourced by Schroders and should be independently verified before further publication or use. No responsibility can be accepted for error of fact or opinion. This does not exclude or restrict any duty or liability that Schroders has to its customers under the Financial Services and Markets Act 2000 (as amended from time to time) or any other regulatory system. Reliance should not be placed on the views and information in the document when taking individual investment and/or strategic decisions.
Past Performance is not a guide to future performance. The value of investments and the income from them may go down as well as up and investors may not get back the amounts originally invested. Exchange rate changes may cause the value of any overseas investments to rise or fall.
Any sectors, securities, regions or countries shown above are for illustrative purposes only and are not to be considered a recommendation to buy or sell.
The forecasts included should not be relied upon, are not guaranteed and are provided only as at the date of issue. Our forecasts are based on our own assumptions which may change. Forecasts and assumptions may be affected by external economic or other factors.
Issued by Schroder Unit Trusts Limited, 1 London Wall Place, London EC2Y 5AU. Registered Number 4191730 England. Authorised and regulated by the Financial Conduct Authority.
Leave a Reply
You must be logged in to post a comment.