Aug
2019
US Survey: Millennials may have a serious debt problem
DIY Investor
1 August 2019
![]()
In a survey of 1,000 millennials, LendEDU found that many members of this generation carry all types of debt, a lot of it, and it was across all income levels – writes Mike Brown
It is no secret that in the United States, debt is a huge component of our economy and it is in abundance amongst American consumers.
Before we get to our own findings, here are some U.S. debt statistics that may or may not frighten you:
- The average American owes $5,472 in credit card debt
- The average American borrower has $27,975 in student loan debt
- The average American has $201,811 of mortgage debt
If used responsibly, debt can be useful for emergencies and other times of need. However, it can spiral out of control quickly and leave borrowers in an inescapable position if they aren’t careful.
As the cost of living in the U.S. increases, we could see Americans needing to take on more debt. This is especially true for millennials, the largest living generation, who are entering the prime of both their earning and spending years being between the ages of 23 and 38.
To evaluate the debt situations of millennial Americans, LendEDU has surveyed 1,000 millennials, split evenly between three income brackets, on a series of questions related to the types and amounts of debt they carry.
The results were quite startling — not only because of the sheer amount of debt that members of this generation were carrying — but also because high levels of debt were reaching everyone, regardless of how much money they made.
Full Survey Results
All 1,000 respondents were from the U.S. and between the ages of 23 and 38. Respondents were split almost evenly between three income brackets: ($49,999 or lower; $50,000 to $99,999; $100,000 or higher).
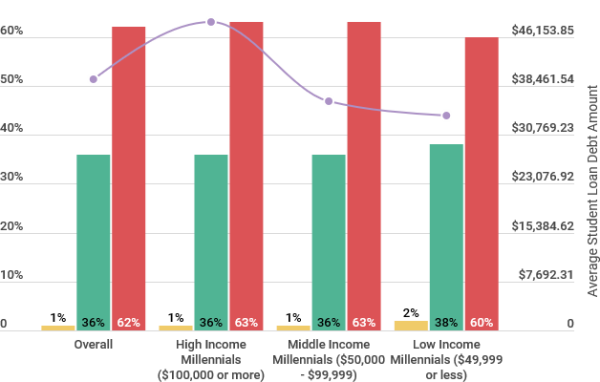
Student Loan Debt
(1) Do you currently carry student loan debt?
(2 — If “YES” to Question 1) How much student loan debt do you currently carry?
![]()
1. The bar chart above represents responses to Question 1.
2. The purple line chart above represents the average amount of student loan debt according to those millennials that answered “YES” to Question 1
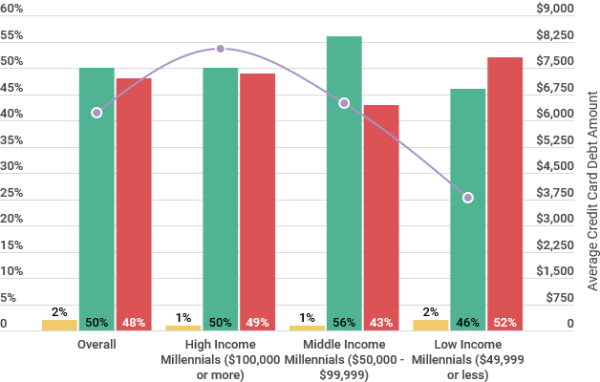
Credit Card Debt
(3) Do you currently carry credit card debt?
(4 — If “YES” to Question 3) How much credit card debt do you currently carry?
![]()
3. The bar chart above represents responses to Question 3.
4. The purple line chart above represents the average amount of credit card debt according to those millennials that answered “YES” to Question 3
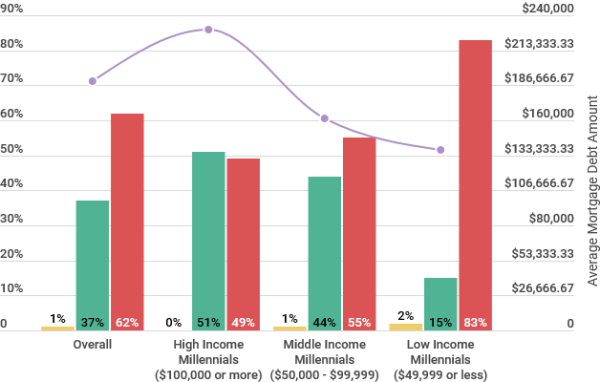
Mortgage Debt
(5) Do you currently carry mortgage debt?
(6 — If “YES” to Question 5) How much mortgage debt do you currently carry?
![]()
5. The bar chart above represents responses to Question 5.
6. The purple line chart above represents the average amount of mortgage debt according to those millennials that answered “YES” to Question 5
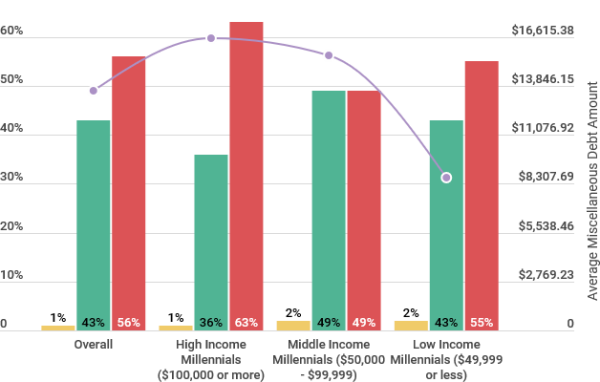
Miscellaneous Debt (Personal, Auto, Medical)
(7) Do you currently carry any other miscellaneous types of debt (personal loan debt, medical debt, auto loan debt, etc.)
(8 — If “YES” Question 7) How much miscellaneous debt (personal loan debt, medical debt, auto loan debt, etc.) do you currently carry?
![]()
7. The bar chart above represents responses to Question 7.
8. The purple line chart above represents the average amount of miscellaneous debt according to those millennials that answered “YES” to Question 7
Observations & Analysis
Credit Card Debt is the Most Prevalent Type of Debt Amongst Millennials
Amongst all the different types of debt that were discussed in this survey, credit card debt was the most widespread. Overall, 50 percent of millennials had some amount of credit card debt; the average amount of plastic-induced debt they carried was $6,206.
For reference, the next most common type of debt was miscellaneous debt, which was held by 43 percent of all millennial respondents. Miscellaneous debt could have been things like personal loan debt, auto loan debt, or medical debt.
Returning to credit card debt, millennials in the middle income bracket making between $50,000 and $99,999 were the most likely to carry it. 56 percent of this cohort had credit card debt, the average being $6,479. 50 percent of high income millennials that earn $100,000 or more had credit card debt; the average amount this group held in credit card debt was $8,040.
Finally, those millennial participants in the lowest income bracket were the least likely to have credit card debt. To be precise, 46 percent of these poll participants had credit card debt, with an average amount of $3,793. To be included in the lower income tier, a millennial had to have an individual annual income of $49,999 or less.
Greatest Millennial Earners Are Also the Greatest Millennial Debtors
It was interesting to see that so many millennials in the uppermost income tier reported back with staggering amounts of debt.
In every single debt category that we covered, millennials that made $100,000 or more had the highest average amount of debt.
Why This Data Makes Sense
This makes sense in a few instances. For example, 51 percent of upper income millennials had mortgage debt with the average amount being $229,032. Comparatively, only 15 percent of low income millennials reported mortgage debt, and those that did had an average of $137,274 in mortgage debt.
Millennials in the high income bracket are the most likely to be homeowners and also the most likely to have greater mortgage debt because they are likely purchasing more expensive homes. They are also more attractive applicants in the eyes of mortgage lenders as compared to their counterparts due to their higher income.
Courtney Barbee, a 33-year-old millennial, spoke on her mortgage situation:
I have around $300,000 remaining on my mortgage, but that’s it. I pay off the balance on my credit cards each month, and my student loans will be paid off in full next month.
Courtney Barbee, 33-year-old millennial, Co-Owner of CFO Consulting Firm
When it comes to student loan debt, all income brackets had similar proportions of millennials with that debt, but high income millennials by far had the highest amounts.
Millennials making $100,000 or more had an average of $48,451 in student loan debt, while middle income respondents had $36,077, and low income millennials had $33,767 in student loan debt.
While the figures could be attributed to a number of variables, a likely scenario is that millennials in the uppermost income bracket received an advanced degree after receiving a bachelors. Medical, dental, law, or any type of graduate school is going to rack up your student loan debt balance quickly. However, any of those advanced degrees usually lead to a larger salary, which explains why they have the most student debt but simultaneously make the most money.
Where This Data Becomes Troubling
So while the trends regarding student loan and mortgage debt can be explained, the other categories are a bit tougher to figure out.
For example, upper income millennials had an average of $8,040 in credit card debt, more than the $6,479 owed by middle income respondents and the $3,793 average that represented the low income poll participants.
Further, high income members of the millennial generation had an average of $16,521 in miscellaneous debt, while middle income and low income millennials had an average of $15,559 and $8,671, respectively.
Granted, wealthier millennials are in a better position to pay off debt when compared to their counterparts, but taking on a considerable amount of debt is never a sound strategy. A large salary isn’t a free pass to take on tons of debt, and compounding interest can turn a minor debt problem into a inescapable hole if it is not monitored diligently.
Additionally, too much can go wrong at any given moment that will make that debt a lot harder to tackle, no matter how much money one makes. For example, a medical emergency can quickly double that credit card debt in the blink of an eye. Or, a borrower could unexpectedly get laid off from his or her job and then suddenly lacks a source of income to pay off debt.
The Implications
It is a bit concerning to see debt so widespread throughout the millennial generation, regardless of class. Debt bubbles become a serious problem when even the wealthiest can’t avoid taking on a bit of financial water. All it takes is one economic downturn and millennials could be staring down some serious trouble. Considering they are the largest living generation, those problems could have far-wider implications for the whole economy.
Miscellaneous Debt Piles on Quickly For Millennials
Perhaps the most surprising finding from this survey was the considerable sum of miscellaneous debt that millennials have accumulated.
43 percent of this generation indicated they had some amount of miscellaneous debt. Specifically, they carried an average of $13,550 in miscellaneous debt. 36 percent of the wealthiest millennials carried an average debt balance of $16,521, while 49 percent of middle class millennials had $15,559 in other debt. Finally, 43 percent of millennials in the lowest tier had an average of $8,671 in extra debt.
Miscellaneous debt could have come from anything including, but not limited to, personal loans, medical loans, and auto loans. Across all income brackets, the amount of miscellaneous debt was concerning, even if it is spread out across multiple types of debt.
Kathryn Mancewicz, a 26-year-old millennial, is working on paying off some miscellaneous debt with her husband:
As of this year, we have paid off all of our student loan debt (~$40,000) and own three cars outright, one of which we just paid off (~$20,000). We were debt free until we decided to purchase an RV so I can work as a traveling Speech Language Pathologist. We put $11,000 down and owe $35,000 currently but plan to pay that off within the next five to six months so we can be totally debt free.
Kathryn Mancewicz, 26-year-old millennial, Personal Finance Blogger at MoneyandMountains.com
To conclude, the troubling amount of miscellaneous debt carried by millennials only further exasperates this generation’s debt problem, something made evident by this survey. The U.S.’s largest living generation is flirting with a dangerously thin line that could turn bad very quickly when the next economic downturn hits.
Methodology
All data that can be found within this report derives from an online survey commissioned by LendEDU and conducted online by polling company Pollfish.
In total, 1,000 American millennials were surveyed for this particular poll. All respondents fell within the ages of 23 and 38, the millennial age range according to Pew. Additionally, a quota was used to ensure we received a near even split of millennials between three income brackets. 340 millennials in the high income bracket, which is an individual annual income of $100,000 or more were surveyed. 330 millennials in the middle income bracket, which is an individual annual income between $50,000 and $99,999, were surveyed. Finally, 330 millennials in the lower income bracket, which is an individual annual income of $49,999 or less, were surveyed. The income brackets are pre-established parameters set by Pollfish.
This survey was conducted over a two-day span, starting on March 1, 2019 and ending on March 2, 2019. All respondents were asked to answer all questions truthfully and to the best of their abilities. Simple averaging was used to find the average debt figures featured in this report.
Leave a Reply
You must be logged in to post a comment.