Dec
2019
Is it too Late to Invest in UK Housebuilders?
DIY Investor
21 December 2019
As a group, UK housebuilders have produced astonishingly good financial results over the last decade – writes John Kingham of UK Value Investor
This has given their shareholders equally astonishing returns, with average share price gains from the largest housebuilders at close to 1,000% since the 2009 financial crisis.
One housebuilder in particular, Bellway, sits at the very top of my stock screen, thanks to its impressively consistent double digit growth, high profitability, low debts and a dividend yield of around 4% (at a share price of 3,800p).
And following the Conservative’s win in the 2019 general election, Bellway’s share priced jumped another 10% or so, rewarding shareholders with yet more capital gains.
‘Bellway’s financial results are astonishingly good’
So are housebuilders set to produce similarly impressive returns over the next decade, or has this particular house party already run its course?
I’ll try to answer that by first looking at the financial results which underpin those impressive share price gains.
Bellway’s financial results are astonishingly good
I’m going to stick with Bellway as it’s one of the better housebuilders in my opinion. Here’s a quick chart showing its quite frankly amazing results over the last decade:
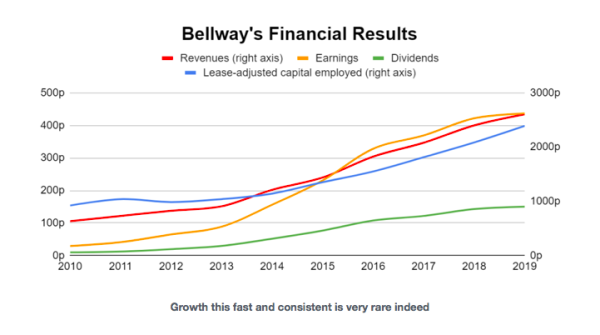
As you can see, everything that’s good (revenues, earnings, dividends etc) has gone up over the last decade, by a lot. For example, its:
- Growth Rate (averaged across revenues, capital employed and dividends) has averaged 23% per year.
- Growth Quality (consistency of growth across revenues, earnings and dividends) has been 100%, i.e. everything went up every year.
- Profitability (averaged across return on sales and return on capital) averaged 15% per year.
- Debt to earnings ratio is very low as Bellway has almost no debt.
These are incredible results and, on top of that, the company has no large pension liabilities and hasn’t made any large or risky acquisitions in recent years.
These are exactly the sort of financial results I like to see in a company, so I think Bellway is definitely worth looking at in more detail.
People will always need houses
Bellway’s core business is housebuilding which means, unsurprisingly, it builds houses.
It does this in the UK, with a fairly even split between houses built in the north and south (split about 48% to 52%, respectively).
It builds mostly for the private market (88%), with a small amount for the social housing market (12%).
Revenues, earnings and dividends have grown enormously over the last decade, primarily because Bellway has built more houses and sold them at higher prices:
The number of houses sold by Bellway has more than doubled from 4,595 in 2010 to 10,892 in 2019 (a 137% increase)
The average price of each house sold has almost doubled from £167,000 in 2010 to £295,000 in 2019 (a 76% increase)
The average net profit per house sold has increased sixfold from £8,000 in 2010 to £49,000 in 2019 (a 533% increase)
These are fantastically good results for a relatively mature company operating in a very mature market. Some might say too good, so let’s look at some negative factors.
‘These are fantastically good results for a relatively mature company operating in a very mature market’
The housing market is cyclical
Houses are capital goods, which means they’re expected to last many years, unlike short-lived products like toothpaste or food. Once you buy a house, you won’t necessarily need to buy another one, ever.
This makes it very easy for people to not buy houses if they’re worried about their job, their spouses job, or the economy in general.
If people are reluctant to buy a house then forced sellers (e.g. those who can’t afford their mortgage or those who need a large cash lump sum) will have to lower their asking price and this can have a significant impact on overall house prices.
For example, at the peak of the previous housing cycle in 2007, Bellway sold 7,638 homes. At the nadir of that cycle, in 2009, Bellway sold 4,380 homes.
That’s a decline of 43%, which is a lot by almost any reasonable standard. This was compounded by a decline in the average selling price, from £177,000 in 2007 to £156,000 in 2009.
And since Bellway’s was unable to reduce its expenses in line with its revenues, the 2007-2009 decline in house prices and homes sold caused profits to decline from £167 million in 2007 to a loss of £28 million in 2009.
That should give you a very clear picture of what can happen to highly cyclical companies (even high quality ones) during a cyclical downturn.
However, a company isn’t uninvestable just because it’s highly cyclical (at least I don’t think it is). But it does mean we should probably try to work out how much of its recent performance (good or bad) is down to where we are in the cycle, and how much is down to the company’s underlying strengths (or lack thereof).
Is the housing cycle largely responsible for Bellway’s results (and those of other housebuilders)?
If we compare Bellway’s results from the current cycle (approximately 2010-2019, so far) to a similar period from the previous cycle (approximately 2000-2009 for the sake of simplicity) then we can see how much it’s grown from one cycle to the next, rather than how much it’s grown within a single cycle.
Here are the raw numbers. Bellway’s:
Average revenue per share went from 864p (2000-2009) to 1,466p (2010-2019), an increase of 70% or 5% per year annualised.
Average earnings per share went from 84p (2000-2009) to 217p (2010-2019), an increase of 158% or 10% per year annualised.
Average dividends per share went from 23p (2000-2009) to 72p (2010-2019), an increase of 216% or 12% per year annualised.
So Bellway’s average annual growth, from one cycle to the next, has been about 9%. That’s still very good, but it’s 14% short of the 23% growth rate achieved from the beginning of this current cycle.
Very simplistically then, we could make a ballpark guess that Bellway is responsible for 9% of its recent annual growth rate, while the housing cycle is responsible for the remaining 14% (this is more about providing context than the specific numbers).
‘consistently spectacular results over the last decade is exactly what we see among the UK’s largest housebuilders’
If I’m right that the housing market cycle is mostly responsible for Bellway’s impressive recent results, then other housebuilders should also have impressive results, regardless of the underlying quality of their businesses (because a rising tide lifts all boats, good, bad or ugly).
And consistently spectacular results over the last decade is exactly what we see among the UK’s largest housebuilders:
Housebuilder 10-year revenue growth to 2019
Barratt Developments140%
Berkeley Group 388%
Bovis Homes 255%
Persimmon 138%
Taylor Wimpy132%
All of these mature companies, operating in a very mature market, have grown revenues by more than 100% over the last ten years. Either these are some of the best companies in the world, run by some of the greatest business minds to have ever lived, or are these companies are riding a cyclical boom and just happen to be in the right place at the right time (Nasim Taleb would probably call them “lucky idiots“).
I know which I think is more likely.
My next question then, is this: Can Bellway consistently grow by about 9% per year from one cycle to the next, or is that cycle-to-cycle growth just down to the size of the current housing boom relative to the previous boom? In other words:
Are housebuilders simply riding the mother of all housing booms?
‘Are housebuilders simply riding the mother of all housing booms?’
To answer that, let’s take a walk through some recent UK housing market history.
First of all, you don’t have to be a property investor to know that the UK went through a massive housing boom during the 2000s.
In the run up to the 2009 financial crisis, banks were handing out money to pretty much anyone that had a pulse. In some cases, they would lend up to 125% of the value of a house, completely removing the need for any sort of deposit and effectively putting the buyer into negative equity from day one.
Of course, that all came to an end with the credit crunch, when the obvious unsustainability of those loans finally turned around and bit the banks (and the taxpayer) on the backside.
But anyone who expected UK house prices to decline from seven-times earnings in 2008 to their historic average of about four-times earnings was sorely disappointed.
Yes, after the credit crunch house prices did decline, from £177,000 to £156,000 in Bellway’s case. And banks did tighten up their lending criteria, which dried up demand as most potential first time buyers in 2009/2010 had no chance of raising a 10% deposit on a £150,000 starter house.
But after the crisis, a combination of record low interest rates and a flawed planning system were more than enough reverse the short-lived price decline by fuelling demand and constraining supply.
This combination was so effective that by 2011 Bellway’s average selling price had surged to £180,000. That’s higher than at the peak of what was then the biggest property bubble in history, and just a couple of years after the near-collapse of the global financial system.
So against all the odds, UK property prices didn’t mean revert back to normal levels after 2009. Instead, a new housing bull market began from already very elevated house price to earnings multiples.
At first the new housing bull market began quite slowly, with Bellway’s average selling price increasing by about 6% per year between 2010 and 2013, and the number of new homes built going up at about the same rate.
But then something odd happened.
New build house prices jumped by 10% in 2014, 5% in 2015 and then a massive 13% in 2016. After that initial price explosion, new build prices have increased at a more pedestrian pace, but still enough to leave Bellway’s average selling price at just shy of £300,000 today.
That’s almost double the price of a new build house at the peak of the 2000-2009 housing bubble.
Along with this sudden jump in house prices came a sudden jump the number of houses sold. Before 2014, Bellway was increasing its number of homes sold by about 6% per year, but in 2014 it sold 21% more homes than in 2013. 2015 and 2016 also saw double digit increases, although as with prices, that has slowed to low single digit growth over the last couple of years.
‘Bellway now sells twice as many homes as it did a decade ago and at almost twice the price’
Thanks to that explosion of new build house prices and homes sold, Bellway now sells twice as many homes as it did a decade ago and at almost twice the price.
This has increased the company’s return on sales (profit margin) to almost 17%, which is about twice the average return on sales it generated through the housing boom of the 2000s.
And with Bellway’s surging revenues and profit margins come surging profits, from £40 million a decade ago to more than £500 million today.
Now, I don’t profess to be an expert in property market cycles, but this certainly doesn’t look like a normal cycle to me (and neither did the last one, come to think of it).
Given that the last UK property bubble ended with the highest property valuation ratios in history, it seems inconceivable to me that UK house prices can continue to double every ten years or so, especially when the earnings that pay for those houses are not increasing even half as quickly.
So although Bellway has grown by about 9% per year from one point in the last cycle to a similar point in this cycle, I think much (most?) of that is due to the incredible scale of the current housing boom, even when compared to what was previously the largest housing bubble in history.
However, before I dismiss the success of Bellway and other housebuilders as simply the result of a housing bubble built on top of the previous bubble, it would be useful to know what caused this huge housing boom in the first place.
Because if we understand what caused the current boom, we might understand what will end it as well.
First published by our friends at:

Alternative investments Commentary » Commentary » Equities » Equities Commentary » Equities Latest » Latest
Leave a Reply
You must be logged in to post a comment.